Department of Biochemistry and Molecular Biology, Jeonbuk National University Medical School, Jeonbuk National University, Jeonju 54907, Republic of Korea.
Jong-Suk kim
Email: jsukim@jbnu.ac.kr
Received : Nov 21, 2024 Accepted : Dec 17, 2024 Published : Dec 24, 2024 Archived : www.meddiscoveries.org
Object: The study evaluates the effects of Haematogenous Oxidation Therapy (HOT) on the blood when a low dose of Ultraviolet-C (UV-C) is directly irradiated to the blood in diabetes and Hyperlipidemia (HL) rabbit model and to evaluate the effects of treatment on diabetic and HL rabbit.
Methods: Type 1 diabetes and HL were induced by intravenous injection of alloxan monohydrate 110 mg/kg and subcutaneous injection of poloxamer 407 137.5 mg/kg (0.7 ml/kg) subsequently into New Zealand white rabbits weighing 2-2.5 kg. After 10 ml blood was collected from rabbits, blood was perfused with oxygen for 10 seconds and UV-C was irradiated to the blood, UV-irradiated blood was transfused back to the original rabbits. This treatment was performed a total of 10 times. It evaluated the effects of the HOT treatment on diabetes and HL through hematological and biochemical analysis.
Results: The results indicated that the reduced body weight and insulin level were increased whereas blood glucose levels and HbA1c concentration were significantly reduced after the HOT treatment was performed when compared to those prior to the HOT treatment. In addition, CRE, BUN and UA levels indicating renal functions were significantly reduced when compared normal rabbits. Furthermore, liver enzymes, lipid profile, blood metabolites, and electrolytes were substantially improved after HOT was applied.
Conclusions: The study evaluated the effectiveness of HOT in the treatment of type 1 diabetes and HL by using auto-transfusion. The evaluation was performed through some biochemical and hematological parameters. As a result, HOT effectively lowered glucose level, improved lipid profile enhanced body weight in diabetic rabbits, showed a hepatoprotective, cardioprotective and protects against renal damage. In addition to, blood gas and electrolytes imbalance were improved.
Keywords: CongenitalUltraviolet-C; Haematogenous Oxidation Therapy (HOT); Diabetes; Hyperlipidemia; HbA1C.
Ultra Violet Irradiation (UBI) of blood was hailed as a miracle therapy for treating serious infections in the mid of 19th century. However, this time period coincided with the widespread introduction of penicillin antibiotics, which were rapidly found to be an even bigger miracle therapy. Moreover, another major success of UBI, which was becoming used to treat polio, was also eclipsed by the introduction of the Salk vaccine. Starting in the 1960s UBI fell into disuse in the West and has now been called “the cure that time forgot [1].
Diabetes was a metabolic disease with high blood glucose levels caused by the metabolic disorder resulting from defects of hormones such as insulin, glucagon or glucocorticoids involved in the metabolism of glucose or by abnormal reactions in the pathway [2]. Because the diabetes was characterized by high blood glucose levels, which leads to a wide range of malfunctions in the metabolic control over carbohydrates, proteins, fats, and electrolytes, it was closely associated with increases in various chronic degenerative diseases [3]. Diabetes emerges as the disease-causing social problems because it has a very high prevalence of a typical chronic metabolic disease. Diabetes goes beyond endemic limits and was becoming an epidemic internationally [4,5]. The incidence of diabetes was very low in Korea when compared to that in Western countries. However, the incidence was gradually increasing in Korea due to recent changes in diet, environment, and lifestyle [6,7].
Oral hypoglycemic agents and insulin formulation for the treatment of the diabetes are continuously developed. However, because it was the chronic disease which was not fully cured once patients develop diabetes, it causes a serious problem [8].
Recently, there has been a gradual increase in mortality due to Coronary Heart Diseases (CHDs). Factors such as hypercholesterolemia, cigarette smoking, diabetes mellitus, and sedentary lifestyle are key contributors to the development of Hyperlipidemia (HL) and atherosclerotic cardiovascular disease. Apart from these factors, there is evidence that suggests certain chemicals can also cause hyperlipidemia and may substantially lead to CHDs. Poloxamer 407 is one such example [9].
Poloxamer 407-induced hypertriglyceridemia and hypercholesterolemia are well-known incidents.
Elevated triglycerides and inhibition due to lipoprotein lipase was the main feature of poloxamer 407- induced hyperlipidemia [10].
Thus, in this study, it was evaluated the effects of Haematogenous Oxidation Therapy (HOT) blood irradiation on diabetes and HL using physical methods with UV light rather than drug therapy such as insulin and statins injection in order to get over diabetes- and HL-causing serious problems with an emphasis on diabetes.
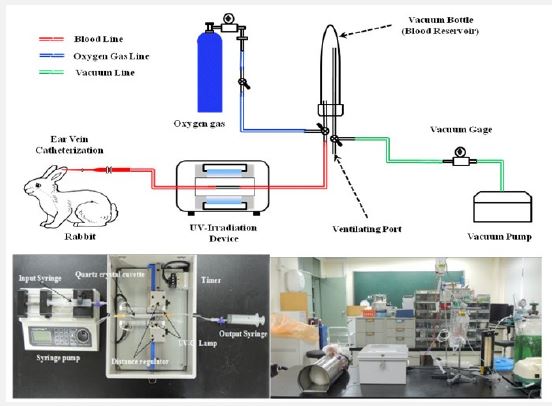
Design of ultraviolet blood irradiation device
In this study, the HOT device was produced to identify effects of ultraviolet blood irradiation on the blood in a diabetic animal model. Figure 1 shows a simple drawing and photo of the HOT device. In brief, a fixing holder for quartz cuvette was installed in the center and Ultraviolet (UV) lamps were installed on both sides of the holder. The UV lamps were designed to adjust the distance from the holder in the center. Ultraviolet blood irradiation was performed in the cuvette.
Experimental animals
Adult male New Zealand White rabbits of body weighing 2 - 2.5 kg were used in the study. All the rabbits were kept in cages with wide square mesh at the bottom to avoid coprophagy and maintained under controlled conditions of humidity, temperature (22±2°C) and 12 hours’ light and dark cycle. Food and water were provided ad libitum. They were fasted for 18 hours prior to the experiment, allowing free access to water only. The experimental protocols were approved by the Institutional Animal Ethics Committee. All experimental protocols (JBNU NON2024-170) were approved by the Committee on the Care of Laboratory Animal Resources, Jeonbuk National University and were conducted in accordance with the Guide for the Care and Use of Laboratory.
Induction of experimental diabetes - Procedure for injecting alloxan monohydrate
The 10 rabbits weighing between 2 to 2.5 kg were made diabetic by injecting intravenously 110 mg/kg body weight of alloxan monohydrate (A7413, Aldrich), a dose confirmed to induce diabetes by our previous study11. Before giving alloxan, the normal blood glucose levels of all rabbits were estimated. After 2 hours of alloxan injection, the 5% Dextrose injected to the all-diabetic rabbits intraperitoneally to prevent a hypoglycemic condition of rabbits with alloxan. After 72 hours of alloxan injection, the blood glucose levels of all surviving rabbits were determined by the glucose oxidase method.
Induction of experimental hyperlipidemia - Procedure for injecting poloxamer 407
Poloxamer 407 (Sigma) was prepared at a concentration of 30% (w/w) in sterile distilled water. The 10 rabbits weighing between 2 to 2.5 kg were made hyperlipidemic by injecting 137.5 mg/kg (0.7 ml/kg) subcutaneously after shaving the dorsal surface of injection, the dose was repeated weekly for 10 weeks.
Haematogenous oxidation therapy
Induction of diabetes was confirmed by measuring blood glucose levels in rabbits at 72 hours (3 days) after alloxan was injected. The blood was collected from diabetic rabbits after 1 week. The blood was perfused with oxygen for 10 seconds. For the HOT, UV was irradiated to the blood collected through auto-transfusion and the blood was transfused back to the original rabbit. Anticoagulation Sodium Citrate Solution (BOIN ACDA SOLN, SBD Co., Ltd.) was used to prevent coagulation of the blood when it was collected. 10 ml blood was collected from the vein by using 20 ml syringe (needle gauge 26). UV light with the intensity of 10.290 J/cm2 was irradiated to the blood which passes at a constant flow rate using the syringe pump in the HOT device. Once UV was irradiated to the blood, the blood collected on the syringe on the other side of the cuvette. After the HOT was performed, the blood transfused back to the original rabbit. The HOT treatment was performed a total of 10 times. Rabbits were stably raised in a laboratory animal breeding facility. Food and water were sufficiently supplied.
Biochemical analysis
Blood was collected from the ear marginal vein. A Nova Stat Profile® pHOx® Ultraanalyzer (NOVA Biomedical Corp., Waltham, MA, USA) was used to measure blood gas, electrolytes, and anion gap. After clotting, blood serum was separated by centrifugation at 3000 rpm for 20 min. The levels of glucose, enzymes, lipids, and proteins were analyzed using a Model 7020 auto-analyzer (Hitachi, Tokyo, Japan).
Serum insulin and HbAlc measurements
Fasting serum insulin levels were measured with a rat insulin enzyme-linked immune absorbent assay kit (LifeSpan BioSciences, Inc., LS-F21890) according to the manufacturer’s protocol. HbA1c ELISA kit (ALPCO Diagnostics, Windham, NH, USA) were quantitated using commercially available kits according to the manufacturers’ protocols.
Statistical analysis
Data were expressed as means ± Standard Errors of the Mean (SEMs). Differences between groups were evaluated by one-way analysis of variance with the Bonferroni post hoc test or by calculation of Spearman’s rank correlation coefficient, as appropriate, using Prism 5.03 (GraphPad Software Inc., San Diego, CA, USA). Statistical significance was set at p< 0.05.
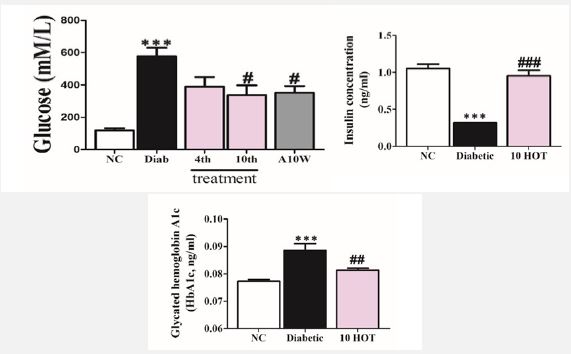
Serum glucose, insulin, and HbA1c concentration
In the diabetic rabbit model induced by alloxan, glucose was increased significantly compared to normal rabbits as shown in Figure 2. However, in the diabetic rabbit model undergoing the HOT treatments, glucose levels were reduced over the course of the treatment.
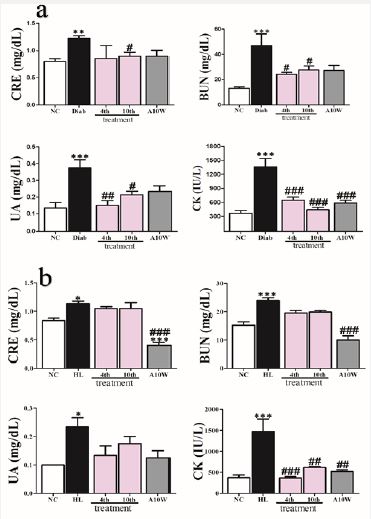
Kidney function test
In diabetes and HL rabbit prior HOT treatment; CRE, BUN, UA and CK levels were elevated significantly when compared to normal group as shown in Figure 3a and 3b. However, after HOT treatments sessions were started these values were significantly reduced when compared to those before HOT was applied.
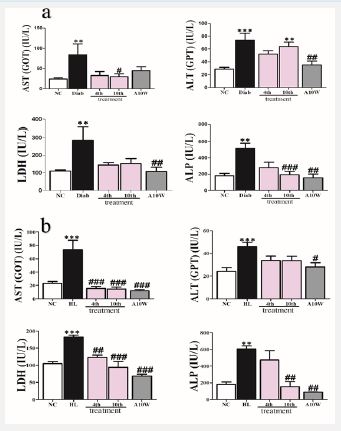
Liver function test
In the diabetic and HL rabbit model induced by alloxan, after one week AST, ALT, LDH, and ALP levels were significantly increased compared to normal rabbits as shown in Figure 4a and 4b. However, after HOT treatments sessions were started these values showed significantly time-dependent reduction when compared to those before HOT was applied.
Lipid profile
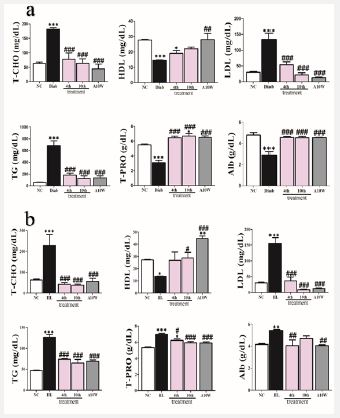
In the diabetic and HL rabbit model, T-CHO, LDL, TG, T-PRO, and Alb levels were increased significantly compared to those of normal rabbits as shown in Figure 5a and 5b. However, after HOT treatments, these levels significantly decreased when compared to those before HOT was applied. In addition, HDL level significantly decreased compared to normal group. However, in rabbits subjected HOT treatment, the level was elevated significantly.
Blood gas, Hb, Hct, and lactate
Blood concentration of PO2, SO2, Hb, and Hct were significantly decreased in diabetic rabbits compared to normal rabbits. However, in HOT-treated rabbits, these parameters significantly improved. Oppositely, PCO2 and lactate were significantly elevated in diabetic rabbits compared to normal rabbits. Never the less, in after HOT treatment, the concentration significantly reduced as shown in Table 1.
Blood ions
Blood concentration of Mg2+ and Ca2+ were significantly decreased in diabetic rabbits compared to normal rabbits. However, in HOT-treated rabbits, these parameters significantly increased. On the other side, K+, Cl-, and AG (anion gap) were significantly elevated in diabetic rabbits compared to normal rabbits. Never the less, in after HOT treatment, the concentration significantly reduced. Na+ concentration although significantly reduced in diabetic rabbits compared to normal group did not increase after HOT treatment as shown in Table 2.
| NC | Diab | 4th | 10th | A10W | |
|---|---|---|---|---|---|
| Na+ (mmol/dL) | 141.4±0.6 | 140.8±0.4* | 133.6±2.5 | 138.0±61.3 | 139.2±0.8 |
| Cl- (mmol/dL) | 97.83±0.70 | 106.0±0.24* | 97.50±3.81# | 96.80±1.41# | 99.36±0.77# |
| Mg2+ (mmol/dL) | 0.55±0.00 | 0.43±0.03*** | 0.59±0.01### | 0.56±0.00### | 0.63±0.00***,### |
| Ca2+ (mmol/dL) | 1.54±0.009 | 1.37±0.031* | 1.57±0.043# | 1.49±0.060 | 1.56±0.029## |
| K+ (mmol/dL) | 4.53±0.13 | 5.83±0.33* | 4.89±0.22 | 4.37±0.64 | 4.50±0.19 # |
| AG (mmol/dL) | 14.51±0.55 | 20.90±0.40* | 14.05±1.40# | 14.67±0.88 | 21.83±2.93** |
Data were reported as means± SEMs (n=10). *: p< 0.05; **: p< 0.01; and ***: p< 0.001 Bonferroni post hoc test following one-way ANOVA versus the NC; normal control: p< 0.05; ##: p< 0.01; and ###: p< 0.001, Bonferroni post hoc test following one-way ANOVA versus Diab; diabetic (after diabetes induced and prior HOT), 4th, 10th treatment, and A10W; fourth treatment, tenth treatment, and 10 weeks after last treatment respectively.
| NC | Diab | 4th | 10th | A10W | |
|---|---|---|---|---|---|
| pCO2 (mmHg) | 21.59±1.09 | 69.75±16.60*** | 31.10±0.98## | 39.08±2.32# | 36.04±2.43## |
| pO2 (mmHg) | 110.4±7.8 | 47.0±1.4** | 155.7±23.3### | 100.5±2.4# | 82.7±7.6 |
| SO2 (%) | 95.74±0.44 | 72.45±3.80*** | 96.60±1.80## | 87.13±4.76 | 86.18±4.93 |
| Hb (g/dL) | 12.26±0.27 | 9.0±0.35*** | 12.48±0.44### | 11.83±0.88## | 13.93±0.22*,### |
| Hct (g/dL) | 36.67±0.91 | 31.75±0.75 | 37.25±1.43 | 35.33±2.72 | 38.25±2.51 |
| Lac (mM/L) | 3.8±0.4 | 9.7±1.5*** | 5.46±0.6***,## | 6.43±0.1 | 7.0±0.4* |
Data were reported as means± SEMs (n=10). *: p< 0.05; **: p< 0.01; and ***: p< 0.001, Bonferroni post hoc test following one-way ANOVA versus the NC; normal control prior diabetes was induced and before HOT: p< 0.05; ##: p< 0.01; and ###: p< 0.001, Bonferroni post hoc test following one-way ANOVA versus Diab; diabetic (after diabetes induced and prior HOT), 4th, 10th treatment, and fourth treatment, tenth treatment, and 10 weeks after last treatment respectively.
To best of our knowledge, there was no published data concerning the effect of HOT in HL and diabetic animal models. However, in a previous study, the result indicated that UBI was safe when used in diabetic rabbits induced by alloxan [11]. The glucose level was significantly reduced and the body weight was significantly decreased after UBI treatments compared to diabetic rabbit prior UBI sessions were started [11]. This experiment followed the same protocol, however, the difference was only that the blood was perfused with oxygen for 10 seconds using sterile oxygen cylinder. A report stated that HOT treatment improves insulin efficiency and blood glucose levels were reduced. In addition, vision was improved in some diabetic patients with different stages of retinitis undergone HOT treatments because RBC aggregation was suppressed [12].
Normally, protein metabolized and hence excreted by the kidney as a urea which was considered a final product of protein and amino acid. High blood urea level indicates a kidney problem. BUN directly affected by protein intake and considered as an indicator of a renal function [13]. The result in Figure 4 showed an increased level of Cre, BUN, UA, and CK, which is in an agreement with a recent study which showed that an increased level of Cre, BUN, and UA in diabetes was well-documented by Ikewuchi and his co-workers [14]. As expected, after treatment with HOT rabbits exhibited a significant reduction in the levels of these indicators, suggesting that HOT effectively enhanced renal function. As kidney was also responsible for regulating ions and electrolyte homeostasis, so an imbalance in electrolytes such as Mg2+, Ca2+, K+, Na+, Cl- considered a deterioration in kidney function of diabetic rats [15]. As shown in table 1 these indicators were significantly improved by HOT treatments.
AST, ALT, LDH, and ALP are indicators of liver function and their elevations indicated liver stress as mentioned by [15,16]. These indicators as shown in Figure 5 were significantly reduced by HOT treatments which supports that HOT has a hepatoprotective effect. This was in a good agreement with our previous study [11] we reported that AST, ALT, LDH, and ALP were significantly improved after UBI treatment.
Our result in Figure 6 as expected showed an elevation in T-CHO, TG, LDL, and decreased level in HDL in diabetic rabbits before HOT sessions were started which agreed with a previous study by [17] who found that diabetic patients are under the risk of Hypertriglyceridemia and hypercholesterolemia with respect to heart and coronary disease. Following HOT treatments, these indicators were significantly improved. Hence, HOT could be used to prevent cardiovascular disease. The result was in a good agreement with our previous study. T-PRO and Alb were significantly decreased in diabetic rabbits. However, after HOT treatment, these indicators were significantly increased, this result coincided with a conclusion made other investigators [11].
Table 1 indicated that pO2 was significantly reduced in diabetic rabbits without HOT treatment whereas pCO2 was significantly increased in diabetic rabbits with HOT. However, these values were significantly improved after HOT treatments which agreed with [17,18]. Lowered blood pH, reduced HCO3-, and increased lactate levels were observed in the diabetic indicating acidic blood, which may be a sign of ketoacidosis [19].
This result coincided with Mattman and Lida [20] who found that UBI improved oxygen delivery, blood elements, and stimulation of mitochondrial oxidation may help the quick recovery of many ailments.
Alloxan causes a high reduction in insulin release by the destruction of the β-cells of the islets of Langerhans, results in hyperglycemia [21]. Impaired glucose tolerance was attained due to lack of insulin in alloxan-induced diabetic rats by destructing the β-cells which leads to type I diabetes [22]. However, insulin level in rabbits subjected to HOT were showed a significant increment in insulin level compared to diabetic rabbits. Fasting serum HbAlc level was an important indicator for patients with diabetes who have cardiovascular diseases. The HbAlc level has been found to be directly proportional to the blood glucose concentration [14,23]. As expected, the HbA1c levels were increased in the diabetic groups in our study, which were lowered by the 10 times treatment protocol of HOT. This outcome could be due to improved insulin secretion [14].
AST, ALT, LDH, and ALP which indicates liver injury caused by hyperglycemia and hyperlipidemia due to tissue insult [24,25]. However, HOT enhanced the liver condition of hyperlipidemic rabbits. This result comes in a good agreement with our previous study concluded that AST, ALT, ALP, and LDH significantly reduced in diabetic rabbits undergoing UBI for eight times with blood oxygenation [11].
Dyslipidemia associated with chronic kidney diseases as concluded by [26]. However, after HOT was applied, hyperlipidemic rabbits showed a significant enhancement in kidney status which can be clarified by a significant decrement in the measured levels of parameters. These results coordinated with a recent study [11] reported that in diabetic rabbits subjected to UBI treatment, a marked enhancement in kidney function namely CRE, BUN, and UA levels were lowered significantly. In our study the reason behind this could be attributed to UV implied in HOT which enhanced tissue blood perfusion and oxygenation.
The study evaluated the effectiveness of HOT in the treatment of type 1 diabetes and HL by using auto-transfusion. The evaluation was performed through some biochemical and hematological parameters. As a result, HOT effectively lowered glucose level, improved lipid profile enhanced body weight in diabetic rabbits, showed a hepatoprotective, cardioprotective and protects against renal damage. In addition to, blood gas and electrolytes imbalance were improved.
However, further study to elucidate the adverse effect of HOT and to elaborate on the mechanisms of action using some molecular and biological techniques. This experiment was a part of a series of experiments in our lab using to remind the scientific community about an old, cheap and effective method of treatment that forgotten for a long time due to an advancement in synthetic and chemical pharmaceutical agents.