Research Article
Volume 3, Issue 6
Photoluminescence of L-Valine Irradiated with Small Doses
Yu А Bandurin1*; Yu V Fedurtsja2 ; А V Rusin2 ; Sh B Molnar3 ; О Yu Bandurin4
1Institute of Electron Physics, National Academy of Sciences of Ukraine, Uzhhorod, Ukraine.
2Municipal Non-Profit Enterprise “Transcarpatian Antitumor Center” of the Transcarpatian Regional Council, Uzhhorod, Ukraine.
3State University “Uzhhorod National University”, Uzhhorod, Ukraine.
4Municipal Non-Profit Enterprise “Regional Hospital of War Veterans” of the Transcarpatian Regional Council, Uzhhorod, Ukraine.
Corresponding Author :
Yu А Bandurin
Email: bandurin_unc@ukr.net
Received : May 25, 2024 Accepted : Jun 21, 2024 Published : Jun 28, 2024 Archived : www.meddiscoveries.org
Citation: Bandurin YA, Fedurtsja YV, Rusin AV, Molnar SB, Bandurin OY. Photoluminescence of L-Valine Irradiated with Small Doses. Med Discoveries. 2024; 3(6): 1178.
Copyright: © 2024 Bandurin YA. This is an open access article distributed under the Creative Commons Attribution License, which permits unrestricted use, distribution, and reproduction in any medium, provided the original work is properly cited.
Abstract
The measurement technique and the results obtained by optical spectroscopy during excitation of L-valine molecules by photons described. The photoluminescence spectra of L-valine studied in the wavelength range 400-700 nm during excitation by photons of different energies 3.26-4.51 eV. Peculiarities were found in the luminescence spectra (radiation intensity, positions of maxima), indicating the excitation of the OH, CO and CH molecules as fragments of the valine molecule by photon impact. The same results obtained for the samples of L-valine irradiated by electrons with the dozes 0.2, 0.5, 2 and 5 Gy. Irradiation of L-valine leads to fragmentation of carboxyl COOH group. The biggest changes in photoluminescence spectra observed for the sample with 0.2 Gy irradiation doze. Also X-ray powder diffraction spectra measured, which showed absence of any structural changes for the irradiated samples. The results (photoluminescence and XRay structural spectra) of melted at 330o C L-valine sample are presented.
Introduction
Amino acids play a fundamentally important role in the human body. For example, the essential amino acid valine (C5 H11NO2 ) takes part in many molecular interactions that occur in the processes of tissue growth and synthesis. The results of the photons and slow electrons interaction with the molecules that make up DNA and RNA are actively studied [1-6]. The study of processes of valine molecules interaction with electrons and photons remains the subject of intensive research [6-15].
When amino acid molecules interact with photons of sufficient energy, photo dissociation processes are possible. Even quanta in the visible and ultraviolet ranges can break one or another chemical bond in a molecule or change its structure. Absorption of a photon by a molecule leads to its excitation, when one or even several electrons move to higher energy levels with subsequent radiation in a wide range of the spectrum. The study of processes occurring in polyatomic molecules of amino acids during their interaction with photons is of great interest both from a theoretical point of view (energy absorption processes, electronic structure of molecules), and important for solving a number of practical problems [16-18].
As part of antitumor therapy, sufficiently energetic electrons interact with cells, which stimulates the formation of a large number of secondary electrons. These secondary electrons that play an important role in the mechanism of radiation damage [19-21]. Their action consists in further ionization of peptide components of DNA with the creation of an avalanche effect, which causes the greatest damage to genetic macromolecules [20,22,23]. Therefore, studying the mechanisms of damage to amino acid molecules by various research methods remains relevant. Damage of molecules is an important step in understanding cell death in general. The study of the result of the interaction of these molecules and the processes occurring during irradiation with relatively small doses (in particular, those used during antitumor therapy) is also of great interest.
When choosing a research method for the study of PhotoLuminescence (PL), it is very important to obtain information from amino acid molecules in their pure form. The use of any solvents leads to redistribution of energy dissipation channels of exciting photons between amino acid molecules and solvent molecules. In addition, the solvent molecules themselves can have luminescent properties, which often leads to distortion of the result. Therefore, this paper presents the results of photoluminescence studies of valine molecules that are in a powdery state. This state called “molecular crystals” because individual micro particles have a crystalline structure.
The composition of the valine molecule includes the same structure for all amino acids, consisting of carboxyl COOH and amine NH2 groups, as well as carbon and hydrogen atoms. A distinctive feature of valine molecules structure is the presence of two CH3 methyl groups, the arrangement of which violates the usual chain or ring structure for amino acids [6].
Experimental setup
Luminescence measurement: We measured the Photoluminescence (PL) spectra of powdered L-valine on a Shimadzu RF6000 spectrofluorophotometer [24]. The fine-grained powder was pressed into tablets in special ring forms made of duralumin with a diameter of 25 mm, the thickness of the valine layer is 1 mm. When measuring the spectra, the samples placed vertically in a holder specially made by us. The angle of incidence of exciting photons from the discharge xenon lamp was 15° to the surface, correspondingly, the angle of luminescence observation was 75°. The choice of such an experiment geometry is due to the need to exclude excitation photons reflected and scattered from the sample surface which can entering the analyzing part of the device. A UFS-5 light filter (transmission band 200÷400 nm, transmission coefficient ~45% at a wavelength of 275 nm) installed at the output slit of the xenon lamp to transmit the ultraviolet range of the spectrum. To prevent the entry of UV photons in front of the entrance slit of the analyzing monochromator, a ZhS-11 light filter was installed (transmission range ≥400 nm, light transmittance ≥92%). Spectra recorded at a speed of 600 nm/min. The scan step of the spectrum was 1 nm. The spectral transmission intervals of both monochromators (both from the photon source and in front of the detector) were chosen equal to 5 nm.
X-ray structural analysis: The structure of L-valine samples as well as irradiated samples we studied by X-ray powder diffraction. Experiments were carried out using a conventional Bragg–Brentano technique with a DRON-4 diffractometer (Cu Kα λ=1,54 Ả radiation, Ni filter, scan mode with the step of 0.02°, exposition time 10 s/step, room temperature, angles interval of 5° ≤ 2θ ≤ 60°) [27].
Materials and its irradiation
Powdered samples of L-valine amino acids with a purity of at least 99.8% we used for the research. Irradiation of samples weighing 3 g carried out on the Halcyon set-up, which used in medical practice for antitumor therapy. An electron beam with an energy of 6 MeV with a diameter of 10 cm provided uniform irradiation of the sample. During irradiation, Flattening Filter Free technology used, which prevents the bremsstrahlung radiation. The determination of the radiation dose carried out using the dosimeter of the device with an accuracy of 1%. Valine is very important during radiation therapy [25,26]. To study photoluminescence spectra, samples irradiated with doses of 0.2, 0.5, 2, and 5 Gy. The first two doses actively used in the medical practice of anticancer therapy. 2 and 5 Gy are an order of magnitude larger.
Results and discussions
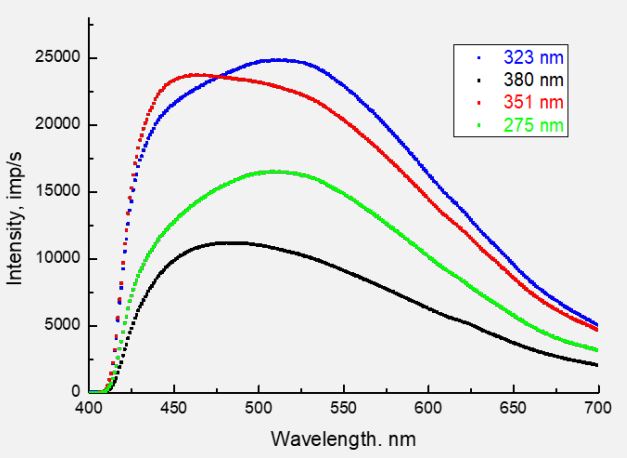
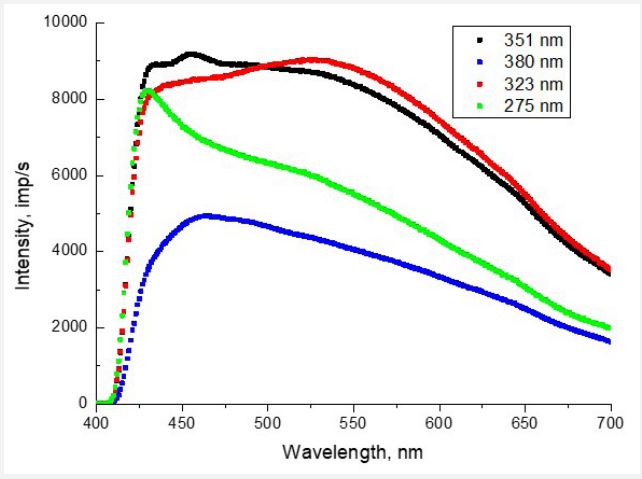
In Figure 1 shows the PL spectra of valine for different wavelengths of exciting photons (λexc = 275, 323, 351, and 380 nm). Depending on λexc, the shape of the spectrum and the position of the luminescence maxima change. As we showed in [6], the luminescence emission on the surface of valine caused mainly by the processes of excitation of diatomic fragments of OH and CO. This interpretation was made by comparing the bond energies of possible diatomic fragments of the valine molecule (ОН4.52 eV; CH-4.2 eV; CC-3.61 eV; CO-3.31 eV; CN-2.89 eV and NO1.7 eV) with the energies of exciting photons 4.51 eV (275 nm); 3.84 eV (323 nm); 3.53 eV (351 nm) and 3.26 eV (380 nm). ОН and СО are part of the carboxyl group of СООН, which is usually the first to react to excitation processes under the action of electrons or photons. Therefore, its fragmentation into ОН and СО is quite likely. The radiation of the COH molecule itself (see, for example [28]) occurs in the far-infrared region of the spectrum and does not fall into the range of 400÷700 nm studied by us. However, it was shown in [29] that COH in the composition of sufficiently large molecules can be manifested both in the absorption spectra (absorption band centered at 359 nm) and in the fluorescence spectra (band centered at 439 nm). Therefore, the possible contribution of the COH molecule radiation to the photoluminescence spectra of valine requires additional research.
The role of the CH group in these photon excitation processes remained unclear. After all, the valine molecule contains at least one CH group and two CH3 methyl groups, the excitation of which could contribute to the PL spectra.
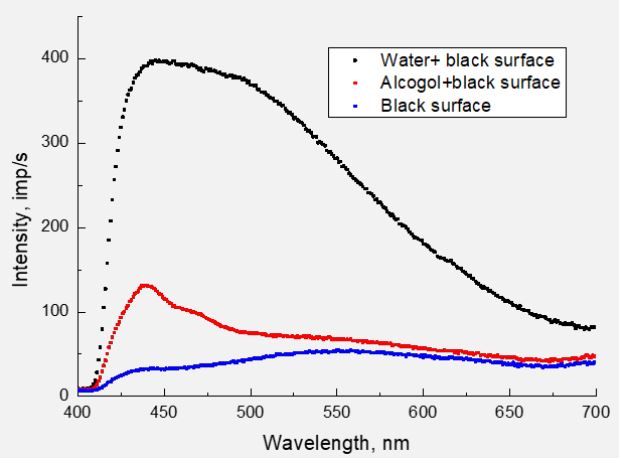
To verify this potential contribution of the CH group to the PL spectra, we investigated the PL spectra of distilled water and ethyl alcohol under the same experimental conditions. For this, drops of water and alcohol were alternately applied using a syringe to the surface of black velvet soaked with aquadag. In Figure 2 shows, as an example, the result obtained for the irradiation of surfaces with photons at λexc=323 nm.
Despite the low PL intensity of alcohol (rapid evaporation from the surface), certain conclusions can be drawn. At least two peaks stand out in the spectrum of water - 445 and 493 nm (possibly there are more of them). There are more of them in the spectrum of alcohol - 440, 465, 550 and a weak maximum at 620 nm. It is clear that the short-wavelength maximum belongs to the OH radical, but in the alcohol spectrum it shifted to the short-wavelength region of the spectrum. It is due to the difference in the location of this radical in the molecular structure.
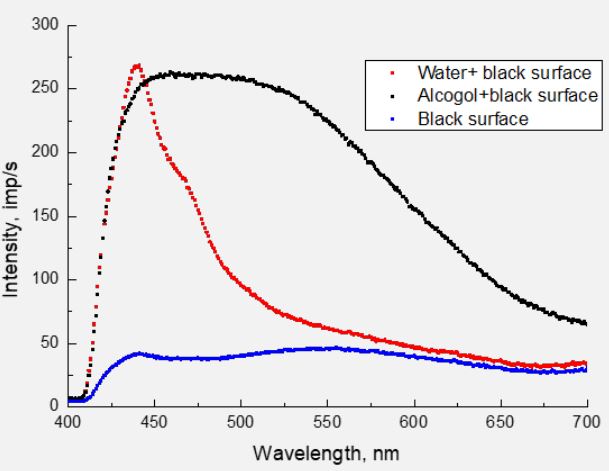
Taking into account that in the spectrum of water, in principle, there cannot be radiation of the CH group, the maxima at 465, 550, and 620 nm owe their appearance to this group. In Figure 3 shows similar spectra for λexc=351 nm, which were obtained before measurement with λexc=323 nm. Therefore, alcohol spectra are much more intense. If no maximum has shifted in the spectra of alcohol (440, 465, 550 and 620 nm), then in the spectrum of water both maxima have shifted to the longwave side - 453 and 506 nm. This can be explained only by the difference in the structural construction of water and alcohol molecules. Strictly speaking, the luminescence of the OH radical fundamentally depends on the environment in the composition of the molecule. At the same time, it should be noted that the energy of the exciting photons significantly affects the PL spectra of both valine (Figure 1) and water.
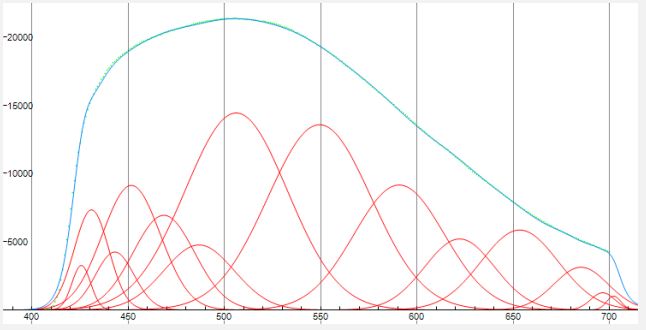
In order to identify the PL emitters of valine, we tried to deconvolve the spectra using Gaussians in the Fytic 1.3.1 program. Figure 4 shows the result for the spectrum of valine at λexc=323 nm as an example. The best match of points (experimental spectrum) and solid curve (result of superposition of Gaussians), can be achieved when using 14 Gaussians (which are shown in red color).
We tried to propose a possible identification of emitters in the PL spectra of valine depending on the location of the Gaussian maxima in the spectral range of 400÷700 nm. This is a very important point in the interpretation of complex PL spectra of valine. The position of Gaussians on the wavelength scale makes it possible to accurately determine the energy of molecular transitions.
The area under the Gaussian is proportional to the excitation cross section of the corresponding vibrational levels. Since this information concerns a molecule with a large number of atoms having the appropriate bonds, it is very important for theoretical calculations and understanding of possible energy dissipation channels of exciting photons. The result presented in the form of Table 1. The identification of short-wavelength maxima (425.6, 430.9, 443, 451.6, 486.8 nm) can be considered reliable based on the analysis of the spectra of water and alcohol.
Table 1: Position of gaussian’s maximum.
| Position of Gaussian’s maximum, nm | Possible emitters |
|---|---|
| 425.6 | OH |
| 430.9 | OH |
| 443 | OH |
| 451.6 | OH |
| 468.5 | CH |
| 486.8 | CH |
| 506.1 | ОН or CO |
| 548.9 | ОН or CO |
| 590.8 | ОН, CO or CH |
| 622.2 | ОН, CO or CH |
| 653.4 | ОН, CO or CH |
| 685.3 | ОН, CO or CH |
| 696.6 | ОН, CO or CH |
| 702.3 | ОН, CO or CH |
The appearance of two strong bands with maxima at 506.1 and 548.9 nm (which are absent in alcohol spectra) can also be attributed with high probability to OH or, more likely, to CO. In the long-wave part of the spectrum, starting with 590.8 nm, we most likely get a superposition of several emitters. Thus, we can conclude that the contribution to the PL spectrum of valine in the range of wavelengths 400÷700 nm occurs not by two, but by three molecules - OH, CO and CH. The possible contribution to the PL spectra of the СOН molecule requires further study.
PL of irradiated valine
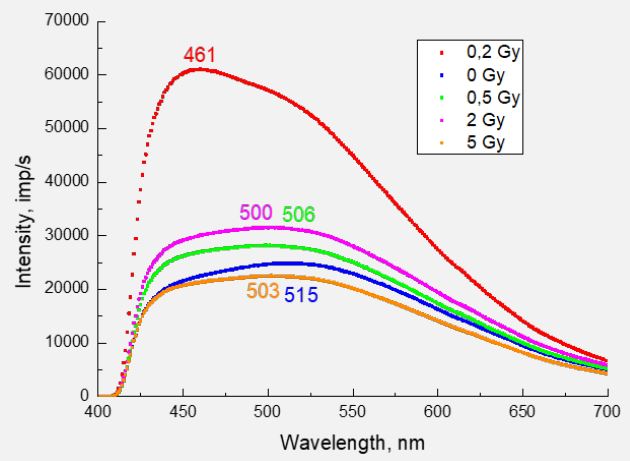
In Figure 5, for example, shows PL spectra for irradiated samples obtained when excited with a wavelength of 323 nm. The numbers of the corresponding color show the position of the maxima in nm on the wavelength scale. Similar spectra were obtained when excited by other λex=275, 351 and 380 nm. A fundamental difference observed in the spectrum of the sample irradiated with a dose of 0.2 Gy. First, the luminescence intensity increases more than twice. Secondly, the maximum shifts to the short-wavelength region (461 nm), where the radiation of the OH radical dominates. For the rest of the samples, the intensity changes at the level of 30%, the long-wavelength maximum always dominates. No clear dependence of the maximum position on the irradiation dose was found, however, it can be noted that its value is always lower than for the non-irradiated sample. This means that the irradiation of valine with electrons accompanied by a change in the carboxyl group of СООН, in particular, the bonds of ОН and СО in the composition of the molecule. It is still difficult to provide an unequivocal answer regarding the fragmentation of the irradiated valine molecule.
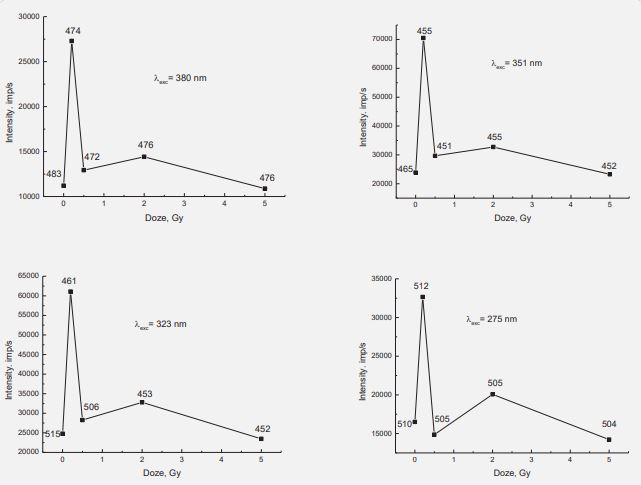
erhaps the entire carboxyl group is detached from the molecule, or it destroyed immediately into the OH radical and the CO molecule. Taking into account the significant shift of the luminescence maximum to 461 nm and a significant increase in the luminescence intensity, the process of valine fragmentation with separation of OH and CO seems more likely. The dependences of the luminescence intensity on the radiation dose for different λexc shown in Figure 6. Numbers indicate the positions of maxima in nm on the wavelength scale.
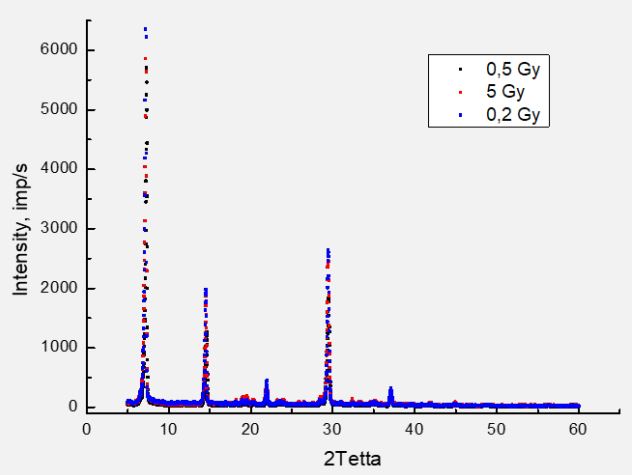
For all four wavelengths of exciting photons, the graphs have the same shape. The highest intensity of luminescence observed at a dose of 0.2 Gy. For the sample with a dose of 2 Gy, a maximum is also observed, and its amplitude is the largest for λex=275 nm (the highest energy of the exciting photons). In addition, for the same λexc, the largest shift in the position of the maximum in the spectra of the irradiated samples observed. Since the excitation photon energy of 4.51 eV is closest to the bond energy in the OH radical of 4.52 eV, it can be assumed that this fragment is associated with the greatest damage to the valine molecule. Finally, we will consider the question of the effect of valine irradiation on its microcrystalline structure. For this purpose, we investigated the X-ray diffraction spectra of valine and irradiated samples. We did not find any noticeable changes, as shown in Figure 7.
We obtained a similar result earlier for much higher doses of irradiation (20÷100 kGy) with electrons with an energy of 12.5 MeV at the M-30 microtron. So we can conclude that the irradiation of valine with electrons with energies of 6 and 12.5 MeV does not change the microcrystalline structure of valine molecular crystals. In its powdered state, crystal structure of valine is “transparent” to electrons with such energies. At the same time, the assessment of the penetration depth of electrons with an energy of 5 MeV into a substance with the density of valine showed that the electrons will stop at a depth of 2 cm. The thickness of the valine layer during irradiation was no more than 2 mm. Thus, electrons passed through without changing the structure of micro crystals.
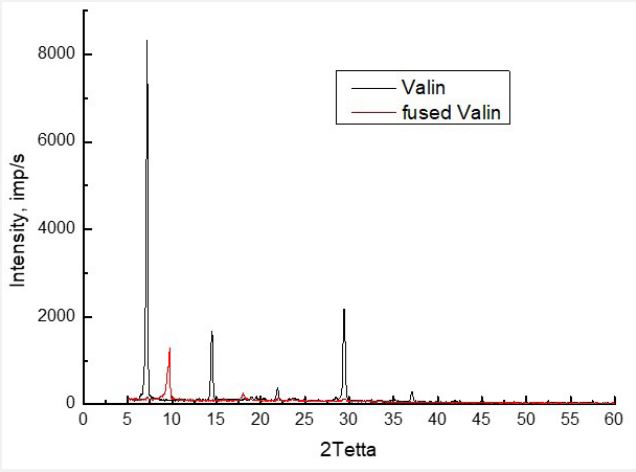
It remains to be determined whether the microcrystalline structure of valine affects photoluminescence spectra at all. For this purpose, we prepared a sample of valine fused at a temperature of 330°C. As the X-ray diffraction spectrum (Figure 8) shows, thermal treatment fundamentally changes the crystalline structure of valine, leaving almost one peak in the spectrum at an angle of 2θ=9o , which is absent in the spectrum of powdered valine. For the same sample, the photoluminescence spectra presented in Figure 9.
Comparison with the spectra of valine in Figure 1 shows the significant influence of the microcrystalline state of valine on the photoluminescence spectra. First, the quantum yield of luminescence decreases by almost 3 times. Secondly, the shape of the spectra changes. Thus, a clearly defined additional maximum at λ=456 nm appears in the spectrum for λexc=351 nm. The difference is especially large for the spectra of λexc=275 nm, that is, for photons with the highest energy. In Figure 9, the maximum of the spectrum is near 430 nm, while in Figure 1 its location is 511 nm. First, this indicates changes in the location of the carboxyl group of COOH. In all four spectra, the intensity in the long-wave spectrum region increases, the maximum near 640 nm becomes more visible, which in our opinion belongs to the CH group. Therefore, it can be conclude that the change in the crystalline structure of valine due to fusion procedures at 330o C significantly changes the photoluminescence characteristics.
Conclusion
The conducted studies of valine photoluminescence made it possible to establish the contribution of OH, CO and CH molecules in the spectral range of 400-700 nm during excitation by photons of different wavelengths. Irradiation of samples by 6 MeV electrons with doses of 0.2, 0.5, 2, and 5 Gy leads to changes in both the shapes of the photoluminescence spectra and the quantum yield. In the studied range of radiation doses, the largest changes in photoluminescence observed for a dose of 0.2 Gy due to the fragmentation of the carboxyl group of COOH. A maximum of luminescence intensity is also observed for the sample irradiated with a dose of 2 Gy. Irradiation of valine with electrons with energies of 6 and 12.5 MeV does not change the microcrystalline structure of powdered valine. The microcrystalline structure of valine significantly affects the formation of photoluminescence spectra, especially when excited by high-energy photons.
Declarations
Author contribution statement: Yu A Bandurin and Sh B Molnar contributed to photoluminescence experiments and analysis of their results. Yu.V. Fedurtsja and А.V. Rusin contributed to irradiation of valine samples and analysis of the results. O.O. Bandurin contributed to X-Ray experiments and analysis of the results. All authors participated in the discussion of results and preparation of the manuscript.
Conflict of interests: The authors declare that they have no conflicts of interest.
Acknowledgments: The authors are grateful to A. Solomon for help in experiments.
References
- L Sanche. Interaction of low energy electrons with DNA: Applications to cancer radiation therapy, Radiation Physics and Chemistry. 2016; 128: 36. https://doi.org/10.1016/j.radphyschem.2016.05.008
- P Papp, P Shchukin, J Kocíšek, Š Matejcík. Electron ionization and dissociation of aliphatic amino acids, J. Chem. Phys. 2012; 137: 105101. https://doi.org/10.1063/1.4749244
- Lukas Tiefenthaler, Milan Ončák, Siegfried Kollotzek, Jaroslav Kočišek, Paul Scheir. Dissociation of Valine Cluster Cations, J Phys Chem A. 2020; 124(41): 8439-8445. doi: 10.1021/acs.jpca.0c07208.
- A.N. Zavilopulo, A.I. Bulgakova. Mass Spectrometry of Glutamic Acid and Glutamine in the Gas Phase, Tech. Phys. Let. 219; 45: 1252. https://doi.org/10.1134/S1063785019120290.
- AN Zavilopulo, OB Shpenik, AN Mylymko, V Yu Shpenik. Mass spectrometry of d-ribose molecules, Int. J. Mass Spectr. 2019; 441(1). https://doi.org/10.1016/j.ijms.2019.03.008.
- Yu A Bandurin, Zavilopulo AN, Molnar Sh, OB Shpenik. Excitation of L-valine molecules by electrons and photons, Eur. Phys. J. D. 2022; 76: 9-14.
- AN Zavilopulo, AI Bulhakova, SS Demes, E Yu Remeta, A V Vasiliev. Ionization and fragmentation of valine molecules in the gas phase by electron impact, Eur. Phys. J. D. 2021; 75: 287. https://doi.org/10.1140/epjd/s10053-021-00294-2.
- AN Zavilopulo, S Demes, E Yu Remeta, AI Bulhakova. ElectronImpact Ionization of the Glutamic Acid and Glutamine Molecules, Ukr. J. Phys. 2021; 66(9): 745. https://doi.org/10.15407/ujpe66.9.745.
- S A Pshenichnyuk, NL Asfandiarov, AS Vorob’ev, Š Matejčík. State of the art in dissociative electron attachment spectroscopy and its prospects Phys. Usp. 2022. accepted. DOI: 10.3367/UFNe.2021.09.039054.
- K Aflatooni, AM Scheer, PD Burrow. Total dissociative electron attachment cross sections for molecular constituents of DNA, J. Chem. Phys. 2006; 125: 054301. DOI: 10.1063/1.2229209.
- K Aflatooni, G A Gallup, PD Burrow. Electron Attachment Energies of the DNA Bases J. Phys. Chem. Α. 1998; 102: 6205. https://doi.org/10.1021/jp980865n.
- I Shafranyosh, M I Sukhoviya, M I Shafranyosh, LL Shimon. Formation of positive and negative ions of thymine molecules under the action of slow electrons, Tech. Phys. 2008; 53: 1538. DOI: 10.1134/S1063784208120025.
- OB Shpenik, AI Bulhakova, AN Zavilopulo, NM Erdevdi, Yu A Bandurin. Electron-Impact-Induced Excitation of Valine Molecules in the Gas Phase. Tech. Phys. Let. 2021; 47(7): 717. DOI: 10.1134/S1063785021070269.
- Van der Burgt PM, Finnegan S, Eden S. Electron impact fragmentation of adenine: Partial ionization cross sections for positive fragments, Eur. Phys. J. D. 2015; 69(1): 173-181. doi: 10.1140/epjd/e2015-60200-y.
- Minaev, B.F. et al. Fragmentation of the adenine and guanine molecules induced by electron collisions, J. Chem. Phys. 2014; 140(17): 175101-1-175101-15. doi: 10.1063/1.4871881.
- Tilmann D Mark. Ionization of Molecules by Electron Impact. In: Electron-Molecule Interactions and Their Applications. 1st ed. L. G. Christophorou. 1984.
- H Abdoul-Carime, S Gohlke, E Illenberger. Fragmentation of tryptophan by low-energy electrons, Chem. Phys. Let. 2005; 402: 497-502. https://doi.org/10.1016/j.cplett.2004.12.073.
- M Dampc, P Możejko, M Zubek. Electron impact ionization and cationic fragmentation of the pyridazine molecules, Eur. Phys. J. D. 2018; 72: 216. https://doi.org/10.1140/epjd/e2018-90474-2.
- Aflatooni K, Scheer AM, Burrow PD. Total dissociative electron attachment cross sections for molecular constituents of DNA. J. Chem. Phys. 2006; 125(5): 054301-1-054501-5. doi: 10.1063/1.2229209.
- C Sonntag. The chemical basis for radiation biology. London: Taylor & Francis press. 1987.
- Hanson KP, Komar VE. Molecular mechanisms of radiation cell death, Energoatomizdat, Moscow. 1985; 141.
- J. Kogl. “Biological effects of radiation, Mir, Moscow. 1986.
- Monteiro WA. Radiation Effects in Materials. 2016. doi: 10.5772/61498
- Shimadzu Spectrofluorophotometer RF-6000 Instruction Manual. Shimadzu Corporation. 2015; 86.
- MA Rahman, E Krishna Kumar. Electron ionization of DNA bases J. Chem. Phys. 2016; 144: 161102. https://doi.org/10.1063/1.4948412.
- G Hanel, et al. Electron Attachment to Uracil: Effective Destruction at Sub excitation Energies, Phys. Rev. Let. 2003; 90(9). DOI: 10.1103/PhysRevLett.90.188104.
- Yu A Bandurin, et al. Fluorescence Excitation Spectroscopy of Glucose Molecules. Journal of Physics & Optics Sciences. 2023; SRC/JPSOS/210. DOI: doi.org/10.47363/JPSOS/2023(5)177.
- Zeng et al. Synthesized complex-frequency excitation for ultrasensitive molecular sensing. eLight. 2024; 4: 1. https://doi.org/10.1186/s43593-023-00058-y.
- Marcelo G Vivas, et al. Molecular Structure-Optical Property Relationships for a Series of Non-Centrosymmetric Two-photon Absorbing Push-Pull Triarylamine Molecules. Scientific Reports. 2014; 4: 4447. DOI: 10.1038/srep04447.

