Research Article
Volume 3, Issue 6
Machine Learning-Based Feature Selection for Predicting Autism Spectrum Disorder in Pediatric Neurodevelopmental Disorders
Maryam Asadinezhad1 ; Leila Pazouki2 ; Zahra Mahmoodkhani3 ; Negareh Poursalehi4 ; Aria Jahanimoghadam5; Maryam Moradnia6 ; Mohammad Yahya Vahidi Mehrjardi7*; Mojtaba Movahedinia8*
1Department of Computer Engineering, Abrar University, Tehran, Iran.
2Department of Biology, University of Louisville, 40292, Louisville, KY, USA.
3Department of Biological Sciences, Trabiat Modarres University, Tehran, Iran.
4Department of Medical Biotechnology, School of Medicine, Shahid Sadoughi University of Medical Sciences, Yazd, Iran.
5Biocenter, Julius Maximilian University of Würzburg, Am Hubland, Würzburg, Germany.
6Department of Laboratory Medicine, Division of Occupational and Environmental Medicine, Lund University, Lund, Sweden.
7Diabetes Research Center, Shahid Sadoughi University of Medical Sciences, Yazd, Iran.
8Children Growth Disorder Research Center, Shahid Sadoughi University of Medical Sciences, Yazd, Iran.
Corresponding Author :
Mohammad Yahya Vahidi Mehrjardi & Mojtaba Movahedinia
Email: mojtabamovahedinia@gmail.com
Received : May 14, 2024 Accepted : Jun 07, 2024 Published : Jun 14, 2024 Archived : www.meddiscoveries.org
Citation: Mehrjardi MYV, Asadinezhad M, Pazouki L, Mahmoodkhani Z, Movahedinia M, et al. Machine Learning-Based Feature Selection for Predicting Autism Spectrum Disorder in Pediatric Neurodevelopmental Disorders. Med Discoveries. 2024; 3(6): 1167.
Copyright: © 2024 Mehrjardi MYV & Movahedinia M. This is an open access article distributed under the Creative Commons Attribution License, which permits unrestricted use, distribution, and reproduction in any medium, provided the original work is properly cited.
Abstract
In this study, we aimed to utilize machine learning techniques to facilitate the early detection of autism in children, with the understanding that early intervention can significantly improve treatment outcomes and enhance self-sufficiency in adult life. Our research focused on 125 samples obtained from clinics in Yazd, Iran. We extracted a total of 22 features, comprising both relevant and irrelevant factors, to train classifiers capable of distinguishing between autistic and non-autistic patients. Employing K-nearest neighbor, support vector machine, and random forest algorithms, we achieved high classification scores, indicating the efficacy of machine learning in autism detection. Furthermore, our analysis identified several features exhibiting significant correlations with autism, providing potential markers for reliable initial diagnosis. By shedding light on these predictive features, our study aims to address the challenges faced by clinics and parents in identifying autism spectrum disorder, ultimately improving diagnostic accuracy and early intervention strategies.
Keywords: Autism spectrum disorder; Neurodevelopmental disorders; Machine learning; K-nearest neighbor; Support vector machine; Random forest.
Introduction
Neurodevelopmental Disorders (NDDs), including Autistic Spectrum Disorder (ASD), Intellectual Disability (ID), and Attention-Deficit/Hyperactivity Disorder (ADHD) are diseases that affect the development of the brain and mental function of the individual and have origins in pregnancy and childhood [1].
The category of Neurodevelopmental disorders comprises a wide range of conditions that are heterogeneous in causality, including rare genetic syndromes, cerebral palsy, congenital neural anomalies, schizophrenia, ASD, ADHD, and epilepsy [2].
NDDs more commonly have onset early in childhood of those affected and will last during their lifetime. They also affect male individuals more frequently than females.
Causes of the NDDs can be divided into genetic and non-genetic causes. Genetic causes include inherited variants and de novo variants. Inherited variants include X-linked traits and recessive inheritance which primarily cause ID, autism, and some other forms of cognitive impairments and copy number variations. De novo variants are like point mutations, deletions and copy number variations (affecting genomic regions), etc., which may be the cause of severe cases of ASD and ID among children. There are also polygenic causes that may mediate ASD, epilepsy, and other NDDs [3].
The accumulation of disruptive variants in genes that enrich the biological pathways for neuronal functioning and regulation of gene expression seems to be associated with ASD [4].
There are also environmental causes such as perinatal injuries, malnutrition, and toxins contributing to the development of ASD.
Among NDDs, ASD has gained significant attention in recent years, due to many reasons such as the cost it imposes on families and societies. ASD develops due to an early altered brain and neuronal organization. DSM-5 has characterized ASD mostly by persistent deficits in social communications and restricted, repetitive patterns of behavior, interests, or activities [5].
Leo Canner and Hans Asperger coined the term autism and categorized it as a mental disorder in 1944. Mental disorders used to be referred to as either “idiocy” or “imbecility” in historical sources, as defined in the Oxford Dictionary in the 16th century. The concept of developmental disorder in psychiatry was introduced based on mental symptoms in 1820 by Étienne Jean Georget (1795-1828), a student of Philippe Pinel (1745- 1826), and Jean-Étienne Esquirol (1772-1840), the pioneers of a modern psychiatric nosology. Pinel adapted the nosography of William Cullen and pioneered his categories of mental illnesses in 1801. He divided psychiatric disorders into idiocy, mania, dementia, and melancholia in his nosography [1].
DSM 5 defines neurodevelopmental disorders as a continuum or spectrum of disorders, consisting of intellectual disabilities, ASD, ADHD, schizophrenia, and bipolar disorder. The comorbidity between disorders such as ASD and ADHD further validates the construct of the NDDs suggested by DSM-5. In addition, autism is recognized as a spectrum that includes Asperger’s disorder and pervasive developmental disorder. Plus, ASD can be accompanied by genetic disorders such as Fragile X syndrome and psychiatric conditions such as ADHD [1].
In this paper, we will use artificial intelligence methods to predict whether a patient could be diagnosed with autism based on clinical descriptions and specific tests such as MRIs. Data is collected from patients who have been diagnosed with autism and other patients who have not (i.e. healthy group). Data is divided into training data, (80% of autistic and control samples) and test data (20% of autistic and control samples). Classifiers have been trained based on the training data and then their performance is assessed using the test data. Evaluation measures including the sensitivity and accuracy of the trained machines are provided in the results.
Additional information such as the correlation of some of the features with the predicted class is also calculated and discussed.
Material and methods
Data for this study is collected from a cohort of patients mostly from 4 major cities in central and southeastern Iran who visited pediatric neurology specialists. A total of 126 patients, 91 out of whom diagnosed with autism and the remaining 35 diagnosed with neurodevelopmental disorders, are examined.
Features
The link between features and ASD could be causative in one direction or another, meaning that the feature may have caused the disease (the case in head size) or the disease may have imposed the feature (the case of seizure). Some of the features may be unrelated to the ASD. Features in ASD are mostly clinical features, asked and determined by the physician. Features in regards to autism can intuitively be divided into these categories: family (familial history, etc.), apparent features (head size, etc.), neurological disorders (seizure, …), movement (motor delay,…), behavioral features (speech, …), genetic disorders (fragile X syndrome) and other disorders.
General features
Age and sex: Patients in this study are in the range of 2-15 years old. Out of them, 40 are females and the remaining are male patients.
Family-related features
Familial history: There is a high correlation between the risk of ASD and the history of the disorder in the family. For instance, a Sandin et al. study found that a child’s risk of ASD increased by 10.3 to 153.0 times when they had a full sibling or co-twin with ASD. ASD has a significant heritability; which has been estimated to fall between 50 and 90 percent in the literature [6]. In our study, 42 patients out of 91 reported to have familial history of ASD in their family.
Consanguinity: Whether the parents are related, i.e. have been descended from the same ancestor. 58 patients were born into consanguineous marriages.
Age of parents
Pregnancy and delivery history: Whether the mother has delivered the child in a natural birth or a c-section.
Neurological disorders
Seizure: The higher occurrence of epilepsy in people with autism and the higher occurrence of autism in epilepsy are now well established. A review by Tuchman and Rapin stated that the reported frequency of epilepsy in autism ranged from 5% to about 40%. Amiet et al. in a meta-analysis of epilepsy in autism, demonstrated a relationship with intellectual disability; epilepsy was present in 21.5% of subjects with autism who also had intellectual disability and 8% of subjects without intellectual disability. The relationships between epilepsy and autism continue to be debated [7].
Developmental delay: When the child fails to reach developmental milestones as compared to peers from the same population, they are said to be developmentally delayed, which is caused by impairment in any such distinct domain as gross and fine motor, speech and language, cognitive and performance, social, psychological, sexual, and activities of daily living.
Apparent features
Head size: Macrocephaly in autism was first noted by Kanner in the year 1943, the first person to describe the disorder. Recent studies by Mouridsen et al. [8] and Courchesne et al. [9] indicate that autism is associated with enlarged total cerebral volume, abnormal electroencephalograms, increased white matter, and decreased gray matter. Also, Abnormalities in the medial temporal lobe, cerebellum, and amygdala have been observed [10]. A myriad of studies show that head circumference in children younger than age 6 is a good index of total brain volume in children with autism Head circumference is often smaller than normal or normal at birth, yet grows more rapid than normal rate at around 4 months of age [8]. In the present study, 17 patients were reported to have macrocephaly and 11 were reported to have microcephaly.
Behavior
Hearing impairment: A study aimed to audiologically assess A group of 199 children and adolescents (153 boys, 46 girls) with autistic disorder [11]. 7.9% were diagnosed with mild to moderate hearing loss, and 1.6% of those who could be tested appropriately were diagnosed with unilateral hearing loss. Plus, 3.5% of all cases were reported to have the characteristics of bilateral hearing loss or deafness which the authors concluded represented a prevalence considerably above that in the general population and comparable to what was reported in populations with mental retardation.
Speech: Impairments in language and social communication are among the primary diagnostic criteria for ASD. Variable characteristics like sensory processing and attention issues frequently interact with the core symptoms, resulting in the heterogeneity of the disorder and the manifestations of the symptoms. In this regard, Mody et al. observed that language abilities may range from being nonverbal to highly idiosyncratic language with echolalia and unusual prosody (tone or inflection) in autistic children [12].
Crawling: A study found H&K crawling to be significantly less frequent among children with ASD (44.2%) versus children with TD (69%) [13].
Shyness: Shyness is one of the features observed clinically in autistic children.
Reaction to sound: Sensory sensitivities are included as a criterion for the classification of ASD in the Diagnostic and Statistical Manual of Mental Disorders 5 [14].
Eye contact: A tendency to avoid eye contact is an early indicator of Autism Spectrum Disorder (ASD), and difficulties with eye contact often persist throughout the lifespan [15].
Sleep quality: Sleep disturbances occur in 40-83% of autistic children [16]. And this can negatively affect their cognitive skills and functioning ability.
Attention deficit: According to the scientific literature, 50 to 70% of individuals with Autism Spectrum Disorder (ASD) also present with comorbid Attention Deficit Hyperactivity Disorder (ADHD) [17].
Movement
Movement disorder: Movement disorders have been often identified in individuals with ASD, with ataxia as well as akinesia, dyskinesia, bradykinesia, Tourette syndrome, and catatoniclike symptoms, etc. reported in several studies. The cerebellum and basal ganglia dysfunction was mentioned, hence some researchers proposed that ASD could be, at least partially, a disorder of movement [18].
Motor delay: Motor delays could be defined as delays in gross motor skills development. Walking, running, sitting, and crawling are the result of certain motor skills and achieving motor milestones. Motor delays are prevalent and can vary in severity.
Genetic disorders
As mentioned above, some of the genetic disorders could directly be linked to ASD, these genetic disorders include Fragile X syndrome, Tuberous Sclerosis Complex, Cornelia de Lange, Down, Angelman, Coffin-Lowry, Cohen Laurence-Moon-Biedel, Marinesco-Sjogren, Moebius, Rett, and Williams syndromes [19].
Other disorders
Neonatal jaundice: It was shown in a study that there is a significant association between neonatal jaundice and the risk of ASD among children [20].
Machine learning algorithms
Machine learning algorithms have long been used to learn and make predictions or decisions without being explicitly programmed. These algorithms play a crucial role in various fields, from data analysis to pattern recognition and predictive modeling. In the following section five essential machine learning algorithms that we have used as classifiers are analyzed.
The K-Nearest Neighbors (KNN) functions on the principle of similarity, where new data points are classified based on their proximity to existing labeled data points [21]. KNN works by calculating the distance between a given data point and its “K” neighboring points in a feature space. One of the most important Similarity and distance metrics used in the KNN algorithm is Minkowski distance, which can be used for any data that is represented as a feature vector.
Minkowski has the general formula of
The L1 Minkowski distance is the Manhattan distance and the L2 distance is the Euclidean distance [19]. Other similarity measures include Cosine similarity, which also works with feature vector data and uses the dot product of the feature values normalized by the lengths of the feature vectors, also there are correlation measures that can be used in the KNN algorithm.
Once the distances are computed, the majority class among these neighbors determines the class label for the new data point [22]. KNN is advantageous in the case of its simplicity and non-parametric nature, making it easy to understand and implement.
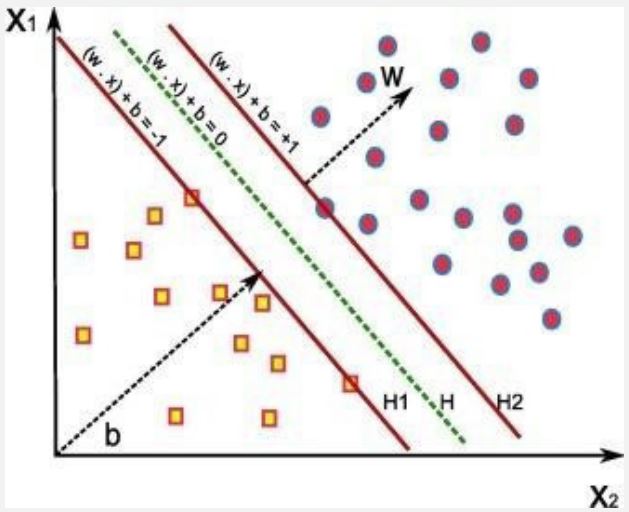
Support Vector Machines (SVM) introduced by Vapnik et al. in 1992 [23] are widely used for classification and regression tasks. SVM works by finding the best hyperplane that separates the data points into different classes, maximizing the margin between them. SVM can handle high- dimensional data efficiently, a benefit that makes it suitable for complex datasets. It uses kernel functions to transform the input space into a higherdimensional feature space and thereby can handle both linearly separable and non-linearly separable data [24].
The naive Bayes classifier greatly simplifies learning by assuming that features are independent given the class, i.e., P(X|C)=Πni=1P(Xi|C). Although independence is generally a poor assumption, it allows for fast computation and makes Naive Bayes particularly useful when dealing with large datasets. Plus, in practice, naive Bayes often competes well with more sophisticated classifiers [26]. One of the key advantages of Naive Bayes is its ability to handle both continuous and discrete data, making it versatile for various domains. Despite its simplicity, this algorithm has demonstrated impressive performance in many real-world applications such as spam filtering, sentiment analysis, and document categorization.
A decision tree is a scheme of a decision procedure, with each node specifying either a class name (the choice) or a feature with different values, determining which will lead to a choice, i.e., a leaf node. Each tree partition (a subtree) corresponds to a classification problem for that subspace of the data [27]. A decision tree can be seen as a divide-and-conquer strategy for object classification, as you can recursively split the data based on specific attribute values. Formally, one can define a decision tree to be either a leaf node (the choice) which is a class name, or a non-leaf node (or decision node) that contains an attribute test with a branch to another decision tree for each possible value of the attribute [28]. Decision trees excel at handling both categorical and numerical data, making them versatile for various problem domains. One key advantage of decision trees is their ability to handle complex relationships between features.
Random Forest is an ensemble machine learning algorithm that combines multiple decision trees to make more accurate predictions. It is well-known for its robustness in handling both classification and regression tasks [29]. The algorithm constructs an ensemble of decision trees by training each tree on a different subset of the training data and a random subset of the input features. Each decision tree independently makes predictions, and the final prediction is decided through a voting or averaging mechanism [30]. Random Forest introduces randomness in two key aspects. First, during the construction of each decision tree, a random subset of the training data, known as bootstrap samples, is selected with replacement. This technique, called bagging (or bootstrap aggregating), introduces diversity and helps reduce overfitting [31]. Also, by randomly selecting a subset of features for splitting each node, Random Forest introduces further variability and prevents certain features from dominating the decision-making process.
Each of the five essential algorithms discussed - KNN, SVM, Naive Bayes, decision tree, and random forest – possesses unique strengths and weaknesses. The K-Nearest Neighbors (KNN) algorithm excels in classification tasks where data is wellclustered. Support Vector Machines (SVM) are effective for both classification and regression problems with complex decision boundaries. Naive Bayes offers simplicity and efficiency for text classification tasks [32]. Decision trees provide interpretability and handle both numerical and categorical data well. Random Forests combine the power of multiple decision trees to improve generalization capabilities.
Results
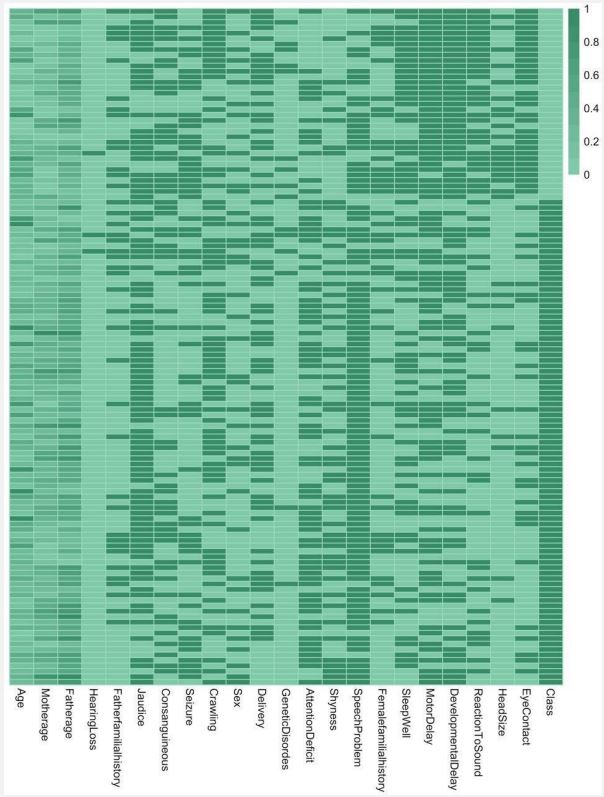
Our data is comprised of 125 patients from 18 months to 16 years old, including 84 boys and 41 girls. Samples and the values of the features are presented and analyzed in the heatmap below.
We implemented the algorithms using Python programming language and trained classifiers based on 80 percent of the data. The rest of the data was used to evaluate the performance of the models. The results of the evaluation measures were exceptionally satisfying. The measures we used for assessing the performances of the models included sensitivity, specificity, and accuracy. Evaluating the performance of AI models is crucial to ensure their effectiveness and reliability. We assessed the performance of our models using some of the key evaluation measures in AI, including accuracy, sensitivity, precision, F-measure, and Receiver Operating Characteristic (ROC), which are discussed below.
Sensitivity, also known as recall or True Positive Rate (TPR), measures an AI model's ability to correctly identify positive instances from all actual positive instances in a dataset. For measuring the sensitivity of a model you are calculating the proportion of true positives identified by the model [33].
Another important measure is Precision, which evaluates an AI model's ability to accurately identify positive instances from all predicted positive instances. It is equivalent to the ratio of true positives to all predicted positives. Precision complements sensitivity by focusing on minimizing false positives [34].
Accuracy is a fundamental evaluation measure that determines the overall correctness of an AI model's predictions [22]. Accuracy is equivalent to the ratio of correctly predicted instances to the total number of instances evaluated:
Specificity is measured by dividing the number of negatives correctly predicted by the model by the total number of negatives predicted [35]. It is formulated as:
Furthermore, the F-measure is the harmonic mean of precision and recall [36]:
The results of the evaluation measures for each classifier are discussed below.
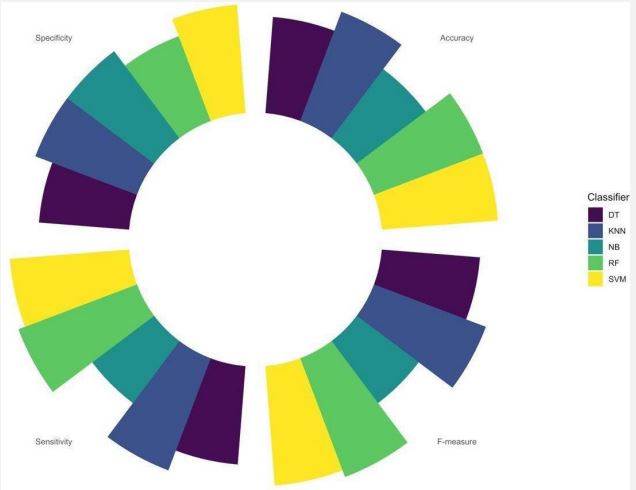
Plotting the accuracy, specificity, sensitivity, and F-measure measures for each classifier, Figure 3 is obtained. Figure 3 demonstrates high performances in every measure of evaluation for almost every classifier. SVM and KNN could have learned more effectively and scored high in every measurement, each with respective scores of 0.95, 0.86, 0.92, and 0.95 in sensitivity, specificity, accuracy, and F-measure measures. Random forest scored 1 in sensitivity and F-measure. Naïve Bayes had the lowest performance among all the classifiers, as expected.
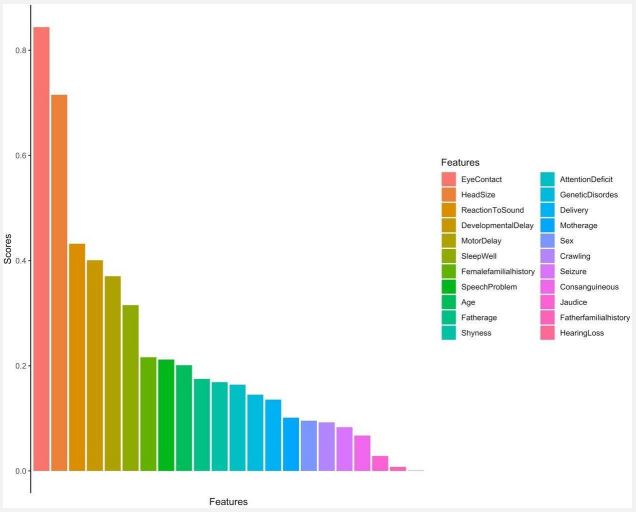
Figure 4 shows how different features correlate with the positive diagnosis of ASD. According to this figure, the most relevant features of ASD are eye contact and head size, followed by reaction to sound, developmental delay, motor delay, and the quality of sleep. Eye contact and head size indicators have been shown to correctly predict the prognosis of ASD with roughly 90 percent and 70 percent accuracy respectively. Those features are further examined in the discussion. Features that have been shown to least correlate with ASD are hearing loss, father's familial history, and neonatal jaundice.
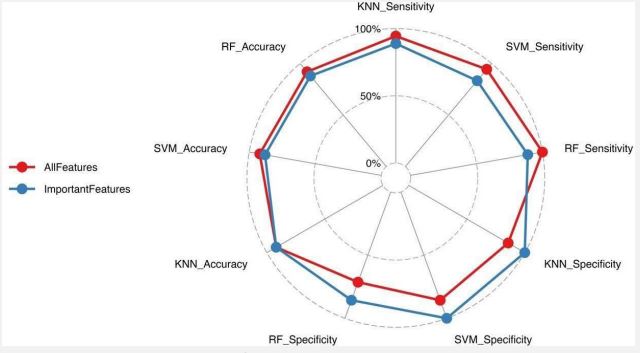
Another question designed by this research was whether all the features were equally important in diagnosing the illness. The unexpected result indicated in Figure 5 as a “radar chart” is that by using some important features, we could predict ASD with better specificity in RF, SVM, and KNN classifiers than we could do if we used all the features. Improvement in the accuracy obtained by using all features instead of just important features is negligible.
Notwithstanding, sensitivity is subtly improved by using all the features instead of the important ones in the mentioned classifiers.
Discussion
Hus and Segal have done a study on the challenges of the identification of ASD due to its shared characteristics with other neurodevelopmental disorders such as ADHD, ID, DLD (developmental language disorder), and DCD (developmental coordination disorder) [37]. The entangled features of these neurodevelopmental disorders, as well as some others, make the diagnosis challenging. So identifying features that are unique to ASD is absolutely essential.
From the heatmap, it is easily evident that the feature 'eye contact' has a very high correlation with the diagnosis of ASD, and just using the "eye contact" feature, classifiers could have predicted ASD with an impressive 90 percent accuracy. The relationship between eye contact and autism is well established in earlier works. Baron-Cohen et al. [38] state that the tendency to avoid looking in the eyes and following the eyes is an early indicator of autism and that in autistic individuals, this trait persists throughout childhood and into adulthood. There have been several models proposed for explaining the eye contact problems in autistic individuals. Among them is the hyperarousal/ gaze aversion model, which implies that looking at the eyes of others is aversive and that people with ASD avoid eye contact and faces to prevent negative affective arousal [39]. A study observed that eye contact triggers over-activation in limbic regions like the amygdala in ASD, which is interpreted as hyperarousal reflection in response to eye contact [40]. Another model called the hyperarousal/social motivation model suggests that the amygdala fails to prioritize social information in the environment and that looking in the eyes doesn’t trigger a reward in the amygdala, thus the autistic individual doesn’t prefer to seek eyes and faces [41]. In another study, the authors tried to subjectively explore the viewpoints of people with self-declared autism [15]. In this study, they try to find out the reasons individuals with autism avoid eye contact from their own declared perspectives. In answering the question "How “do people with ASD experience eye contact?” they categorize the reports into several themes, including “adverse reactions," invasion," "sensory overload," "social nuances,” and “nonverbal communication”.
Another important feature of the study was head size. In previous studies, head size has been shown to be an early indicator of autism. Although the head circumference of infants is smaller or normal at birth, its volume increases rapidly after 4 months of age [8]. In a study by Courchesne et al. it was demonstrated that about 60% of children with autism manifested this abnormal growth, and only 6% of normal children showed this trait [7].
Screening for autism in young children can occur with regular visits to the specialist during the developmental milestones from 1 month of age to 60 months or later. The earlier the disorder is detected, the better the intervention outcomes will generally be [42].
AI detection, with the aid of machine learning algorithms as simple as those we have exploited, can be used as a way of making more reliable diagnoses. Moreover, machine learning techniques can be used for the prediction of ASD later in life. Amit et al. [43] predicted ASD with machine learning using the developmental records of 1187397 children from birth to 6 years of age. They showed that they could predict ASD in children before they were officially diagnosed with it in “maternal child health clinics," with a higher sensitivity than reported models.
Conclusion
The present study emphasizes the prediction and diagnosis of autism using the most relevant and reliable features, which we were able to identify using several algorithms. These features include eye contact, head size, reaction to sound, developmental delay, motor delay, and the quality of sleep. Important features could be critical for the prognosis of an illness in the sense that they significantly lower the time and cost of the initial prediction. The doctor can examine the so-called important features in the patient, and if the result is indicative of the chance of the condition, then the patient is referred to the specialist for further examinations, thus the extended costs. In future work, we may be able to prove that, using just these features, autism can be predicted in infants.
References
- Morris-Rosendahl DJ, MA Crocq. Neurodevelopmental disordersthe history and future of a diagnostic concept. Dialogues in clinical neuroscience. 2020; 22(1): 65-72.
- Khorsand B, et al. Oligo COOL: A mobile application for nucleotide sequence analysis. Biochemistry and Molecular Biology Education. 2019; 47(2): 201-206.
- Sherr EH. Neurodevelopmental Disorders, Causes, and Consequences, in Genomics, Circuits, and Pathways in Clinical Neuropsychiatry. 2016; 587-599.
- Janfaza S, et al. Cancer Odor Database (COD): A critical databank for cancer diagnosis research. Database. 2017; 2017; bax055.
- Hodges H, C Fealko, N Soares. Autism spectrum disorder: definition, epidemiology, causes, and clinical evaluation. Translational pediatrics. 2020; 9(Suppl 1) S55.
- Xie S, et al. The familial risk of autism spectrum disorder with and without intellectual disability. Autism Research. 2020; 13(12): 2242-2250.
- Besag FM. Epilepsy in patients with autism: Links, risks and treatment challenges. Neuropsychiatric disease and treatment. 2017; 1-10.
- Mouridsen SE, B Rich, T Isager. A comparative study of genetic and neurobiological findings in disintegrative psychosis and infantile autism. Psychiatry and clinical neurosciences. 2000; 54(4): 441-446.
- Courchesne E, R Carper, N Akshoomoff. Evidence of brain overgrowth in the first year of life in autism. Jama, 2003; 290(3): 337-344.
- Courchesne E, K Pierce. Brain overgrowth in autism during a critical time in development: implications for frontal pyramidal neuron and interneuron development and connectivity. International journal of developmental neuroscience. 2005; 23(2-3): 153-170.
- Rosenhall U, et al. Autism and hearing loss. Journal of autism and developmental disorders. 1999; 29: 349-357.
- Mody M, JW Belliveau. Speech and language impairments in autism: Insights from behavior and neuroimaging. North American journal of medicine & science. 2013; 5(3): 157.
- Lavenne-Collot N, et al. Early motor skills in children with autism spectrum disorders are marked by less frequent hand and knees crawling. Perceptual and Motor Skills. 2021; 128(5): 2148-2165.
- Kuiper MW, EW Verhoeven, HM Geurts. Stop making noise! Auditory sensitivity in adults with an autism spectrum disorder diagnosis: Physiological habituation and subjective detection thresholds. Journal of Autism and Developmental Disorders. 2019; 49(5): 2116-2128.
- Trevisan DA, et al. How do adults and teens with self-declared Autism Spectrum Disorder experience eye contact? A qualitative analysis of first-hand accounts. PloS one. 2017; 12(11): e0188446.
- Whelan S, et al. Examining the relationship between sleep quality, social functioning, and behavior problems in children with autism spectrum disorder: A systematic review. Nature and science of sleep. 2022; 675-695.
- Hours C, C Recasens, JM Baleyte. ASD and ADHD comorbidity: What are we talking about? Frontiers in psychiatry. 2022; 13: 837424.
- Bell L, A Wittkowski, D Hare. Movement disorders and syndromic autism: A systematic review. Journal of autism and developmental disorders. 2019; 49: 54-67.
- Genovese A, MG Butler, The autism spectrum: behavioral, psychiatric and genetic associations. Genes, 2023. 14(3): 677.
- Jenabi E, S Bashirian, S Khazaei. Association between neonatal jaundice and autism spectrum disorders among children: a metaanalysis. Clinical and Experimental Pediatrics. 2020; 63(1): 8.
- Khorsand B, et al. Alpha influenza virus infiltration prediction using virus-human protein- protein interaction network. Math Biosci Eng. 2020; 17(4): 3109-3129.
- Khorsand B, A Savadi, M Naghibzadeh. SARS-CoV-2-human protein-protein interaction network. Inform Med Unlocked. 2020; 20: 100413.
- Khorsand B, A Savadi, M Naghibzadeh. Comprehensive hostpathogen protein-protein interaction network analysis. BMC bioinformatics. 2020; 21: 1-22.
- Razavi SA, et al. Metabolite signature of human malignant thyroid tissue: A systematic review and meta-analysis. Cancer Med. 2024. 13(8): e7184.
- Cervantes J, et al. A comprehensive survey on support vector machine classification: Applications, challenges and trends. Neurocomputing. 2020; 408: 189-215.
- Samandari-Bahraseman MR, et al. Various concentrations of hesperetin induce different types of programmed cell death in human breast cancerous and normal cell lines in a ROS-dependent manner. Chemico-Biological Interactions. 2023; 382: 110642.
- Sahlolbei M. et al. Engineering chimeric autoantibody receptor T cells for targeted B cell depletion in multiple sclerosis model: An in-vitro study. Heliyon. 2023; 9(9).
- Rostami-Nejad M, et al. Systematic review and dose-response meta-analysis on the Relationship between different gluten doses and risk of coeliac disease relapse. Nutrients. 2023; 15(6): 1390.
- Kharaghani AA, et al. High prevalence of Mucosa-Associated extended-spectrum β-Lactamase- producing Escherichia coli and Klebsiella pneumoniae among Iranain patients with Inflammatory Bowel Disease (IBD). Annals of Clinical Microbiology and Antimicrobials. 2023; 22(1): 86.
- Soltanyzadeh M, et al. Clarifying differences in gene expression profile of umbilical cord vein and bone marrow-derived mesenchymal stem cells; a comparative in silico study. Informatics in Medicine Unlocked. 2022; 33: 101072.
- Shiralipour A, et al. Identifying Key Lysosome-Related Genes Associated with Drug-Resistant Breast Cancer Using Computational and Systems Biology Approach. Iranian Journal of Pharmaceutical Research. 2022. 21(1).
- Samandari Bahraseman MR, et al. The use of integrated text mining and protein-protein interaction approach to evaluate the effects of combined chemotherapeutic and chemopreventive agents in cancer therapy. Plos one. 2022; 17(11): e0276458.
- Khorsand B, et al. Overrepresentation of Enterobacteriaceae and Escherichia coli is the major gut microbiome signature in Crohn’s disease and ulcerative colitis; a comprehensive metagenomic analysis of IBDMDB datasets. Frontiers in Cellular and Infection Microbiology. 2022; 1498.
- Khorsand B, A Savadi, M Naghibzadeh. Parallelizing Assignment Problem with DNA Strands. Iranian Journal of Biotechnology. 2020; 18(1): e2547.
- Zahiri J, et al. AntAngioCOOL: computational detection of antiangiogenic peptides. J Transl Med. 2019; 17(1): 71.
- Sadeghnezhad E, et al. Cross talk between energy cost and expression of Methyl Jasmonate- regulated genes: from DNA to protein. Journal of Plant Biochemistry and Biotechnology. 2019; 28: 230-243.
- Hus Y, O Segal. Challenges surrounding the diagnosis of autism in children. Neuropsychiatric disease and treatment. 2021; 3509-3529.
- Baron-Cohen S, J Allen. C Gillberg Can autism be detected at 18 months?: The needle, the haystack, and the CHAT. The British Journal of Psychiatry. 1992; 161(6): 839-843.
- Senju A, MH Johnson. Atypical eye contact in autism: Models, mechanisms and development. Neuroscience & Biobehavioral Reviews. 2009; 33(8): 1204-1214.
- Dalton KM, et al. Gaze fixation and the neural circuitry of face processing in autism. Nature neuroscience, 2005; 8(4): 519-526.
- Scott-Van Zeeland AA, et al. Reward processing in autism. Autism research. 2010; 3(2): 53- 67.
- Landa RJ. Efficacy of early interventions for infants and young children with, and at risk for, autism spectrum disorders. International Review of Psychiatry. 2018; 30(1): 25-39.
- Amit G, et al. Early Prediction of Autistic Spectrum Disorder Using Developmental Surveillance Data. JAMA network open. 2024; 7(1): e2351052-e2351052.


