Research article
Volume 2, Issue 4
Monitoring Important Phenological Stages of Rice with Multi-Season Rice Crop Profile Using Indian SCATSAT-1 Data
Dipanwita Haldar*; Ashutosh Panda; Suresh Kumar; Prakash Chauhan
Indian Institute of Remote Sensing, Dehradun, India.
Corresponding Author :
Dipanwita Haldar
Email: dipanwita@iirs.gov.in
Received : Mar 02, 2023 Accepted : Apr 14, 2023 Published : Apr 21, 2023 Archived : www.meddiscoveries.org
Citation: Haldar D, Panda A, Kumar S, Chauhan P. Monitoring Important Phenological Stages of Rice with Multi-Season Rice Crop Profile Using Indian SCATSAT-1 Data. Med Discoveries. 2023; 2(4): 1034.
Copyright: © 2023 Haldar D. This is an open access article distributed under the Creative Commons Attribution License, which permits unrestricted use, distribution, and reproduction in any medium, provided the original work is properly cited.
Abstract
Use of SCATSAT-1 Ku-band scatterometer data and Sentinel-1A IW Level 1 (L1) GHDH (ground-range detected, high resolution) product for monitoring rice crop phenology in Mekong Delta region of Vietnam. Five-day composite data was used covering a part of Mekong Delta in Vietnam for multiple season in year 2018-19 spanning over 10 months covering three crops of rice. Sentinel-1 Data was used for demarcating predominant rice sites with multiple date rice transplantation with accuracy above 90%. Analysis shows the dual peak backscatter profile of rice crop (at tillering stage and another at maturity) in Ku-band while in C-band only single peak pattern coinciding with peak vegetative stage was discernible. During transplantation backscattering is minimum (less than -15 dB) increases gradually with increased number of scatterers with advancement in phenological stages. Minimum backscattering is observed during transplantation because of flooded condition and another low backscattering is observed during heading stage in Ku-band. The exponential curve smoothing was used as it matched well with the observed dates to show different rice growth stage in Ku-band. The slope in the second peak varied with crop transplantation and variety, and shows positive correlation with the rice heading stage characteristic. Finally the maps were prepared for different date transplantation and heading stage using Ku-band and validated with the Classified Sentinel-1A map for different transplantation dates. It was found both classified transplantation maps from Sentinel-1 and SCATSAT-1 have agreement over 72% cases. The heading stage map derived from Ku-band also has good agreement with the transplantation map.
Keywords: SCATSAT-1; Sentinel-1A; Rice monitoring; Regional assessment; Rice phenology.
Introduction
Synthetic Aperture Radar (SAR) has ability to capture crop characteristics particularly from structural and physical perspective [1,2] which are not feasible by optical sensing instruments. The discrimination potential of SAR data is based on the sensitivity of the radar backscattering to the dielectric properties of the objects and to their geometric structure (i.e., the size, shape, and orientation and distribution of the scatter). SAR-based techniques have been recognized as an attractive alternative for mapping and monitoring rice crop dynamics due to the independency of radar signals to cloud coverage and illumination conditions [3,4]. Moreover, SAR data availability has increased tremendously since the launch of Sentinel-1A on 3 April 2014, which is the first operational SAR mission, operated within the European Commission’s Copernicus program [5] to provide free seemless data in wider swath to the entire global user community. It is designed for continuous near real-time land monitoring, providing dual-polarized (VV/VH) SAR images over entire Europe (acquired in the IW mode) at a spatial resolution of ‘5 m × 20 m’ every 4 days and globally at least every 12 days. Furthermore, the recent launch of Sentinel-1B on 25 April 2016 has doubled the revisit time. Plenty of research has been carried out for mapping and monitoring rice areas using SAR backscatter. Among those studies, co-polarized (HH) backscatter and co-polarization ratio (HH/VV) images were the most commonly used data sets, which show high correlations with the rice-growing cycle. The utilization of cross-polarized backscatter (HV or VH) has received less attention, likely due to the limited availability of such acquisitions but were found to improve the accuracy particularly in case of upland rice. The potential of dense C-band SAR backscatter time series for mapping rice seasonality has been investigated by. Crop discrimination is usually an important step for development and management of crop monitoring systems. In the last two decades, the use of remote sensing techniques for data assimilation to crop management and crop yield forecasting models has been tremendously increasing [6].
It is important to note that the electromagnetic response of the different parts of a crop cover not only depend on the wavelength and angle of incidence of the sensor used for observation, but also shows variations depending on the season, illumination intensity, weather phenomenon and the target parameters. [7] used ERS SAR, RADARSAT and optical images to determine agricultural crop classes based on devoted per-parcel classification and photo interpretation schemes. A hierarchical classification strategy was applied in order to take into account the spectral signatures variability within each crop type. Reported that scattering mechanisms for agricultural targets is complex and the scattering will be either a direct backscatter from bare soil/underlying ground (or) direct backscatter from the plant components (leaves, stems, fruit) (or) double bounce backscatter between the soil surface and crop canopy (or) the multiple scattering mechanisms in some cases like ground-vegetation-ground. The greater the amount of energy scattered back to the sensor, the brighter the response recorded in the radar image.
Phenology is the study of the timing of the biological events in plants and animals such as flowering, leafing, hibernation, reproduction, and migration. Scientists who study phenology are interested in the timing of such biological events in relation to changes in season and climate. Most of the phenology based work refers to the BBCH scale in order to discriminate the principal growth stages. Few of them are discernible by remote sensing technique when the data acquisition and phenological stage precisely match. The ones influencing the reflectance in optical domain are sensible in the visible range. But most of the previous studies report saturation of the optical wavelength in advanced crop stages due to limited penetration. The structural and the geometric bio-observables during the rice phenophase can be manifested by the longer wavelength hence discernible by microwave sensing. Moreover the crop components viz. leaves, stems, tillers etc. match the wavelength and hence provide us information on specific plant component. Earlier work using X-band report small structure sensitive properties for cereal crops viz. wheat, barley and oats [8]. Studied “Mapping rice extent and cropping scheme in the Mekong Delta using Sentinel-1A data” for assessing rice crop phenology tried to analyse the relationship between the growing cycle of rice plants and the temporal variation of SAR backscatter at different polarizations. They found that VH backscatter is more sensitive to rice growth than VV backscatter and several vegetation phenological parameters including beginning date, heading date and the length of the growing season were extracted from the VH backscatter time series. Rice-cultivated areas were delineated based on seasonal phenological parameters using decision tree approach. Monitoring the rice fields with the help of scatterometer has been demonstrated in the past by and the study proves the efficacy of wide scale monitoring for regional and country scale. They studied rice crop phenology in two predominant rice growing states of India during monsoon season using high temporal Ku-band data from QuikSCAT. They observed dual peak (vegetative stage and maturity stage) and dip (transplantation stage and heading stage) with minimum backscattering at heading stage.
The high temporal resolution of Sentinel-1 observations is expected to further improve the classification accuracy for such SAR-based multi-temporal rice crop monitoring methods for smaller sections. But wide region or country scale monitoring of transplantation, heading and harvest can be attained by higher temporal but coarser resolution data like scatterometer which works on the same principle as SAR. The goal of this study was to (1) analyse temporal variations of backscatter profile and rice growth at different polarizations, (2) classify rice field extents, and crop growth seasonality in the Mekong Delta based on Scatterometer data.
Study area description
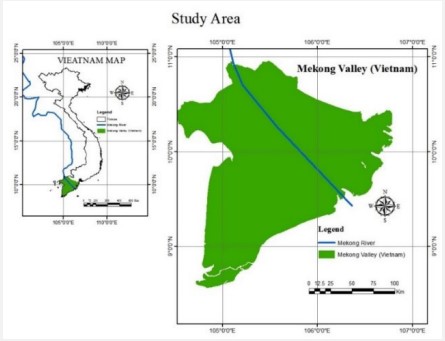
Study area: Part of the Mekong Delta has been selected. Vietnam is the world’s sixth-largest rice producer and the thirdlargest rice exporter (7 million metric tons) after India and Thailand, with the Mekong Delta being the main cultivation area [9]. However, in recent years, impacts of climate change [10] and human activities [11] is increasingly threatening rice production systems of the region. Therefore, systematic rice crop mapping and monitoring in the Mekong Delta plays an important role for sustainable development as well as economic and ecological planning.
More than 80 percent of the people living in the Mekong River basin rely on the river for agriculture or fishing. Lower Mekong basin is used for agriculture, which accounts for 90 percent of all water use. The Mekong Delta is a low-level plain not more than three meters above sea level at any point and crisscrossed by a maze of canals and rivers. Much of the area is covered by rice paddies that are irrigated by delta water and fertilized by delta silt. Many paddies and farms produce three crops of rice a year, enough to feed the entire country, with some left over to export, almost half of Vietnam’s exported rice comes from the Mekong Delta. The Mekong Delta contributes 27 percent of Vietnam’s GDP according to the 2009 Mekong Delta Climate Change Forum Report (ICEM, 59).
Weather
The Mekong Delta, being located in a tropical monsoon region, is hot year-round and has a seasonal distribution of drywet months depending on the operation of the monsoon. The dry season usually coincides with the period of control of the North- East monsoon that lasts from November to April. The wet season coincides with the period of control of the SouthWest monsoon that lasts from May to October, and the climate is characterized by hot, humid, and high rainfall. The average temperature in January varies from about 27-28°C. May is the month with the lowest temperature (an average of 25.5°C). The Mekong Delta has an average rainfall of approximately 1800 mm, but with an uneven distribution in both space and time.
Data sets
SCATSAT-1
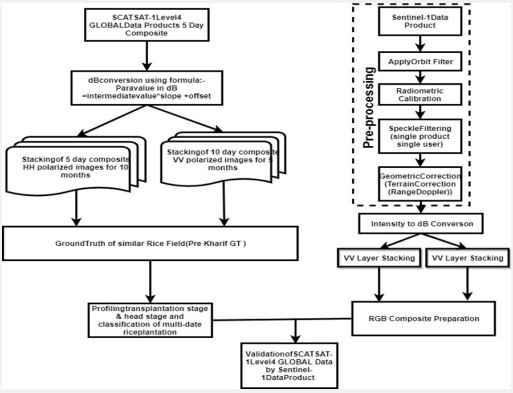
The SCATSAT-1 is an active Scatterometer. It was basically designed to measure ocean surface wind velocity. The sensor transmits signals at regular interval and receives energy backscattered by the targets on the Earth. The DPGS generates Level 1B product from the sensor data. The Level 1B product carries back scattering coefficient (or sigma0) and other radiometric parameters along with geo-location information. The Level 4 products are generated from Level 1B products. Basically, SCATSAT-1 Level 4 GLOBAL data products of sigma0 product carries the sign of parameter in linear scale. Rest of the bits carry sigma0 value in dB.
para_value_in_dB = intermediate_value * slope + offset
Table 1: Slope and offset for products-Source 1:- SCATSAT-1 Level 4 Data Products Format Document.
| Product Parameter | Slope | Offset | Minimum | Maximum | Physical unit |
|---|---|---|---|---|---|
| Sigma0 | 0.001 | -50 | -50 | 15 | dB |
| Brightness Temperature | 0.01 | 0 | 0 | 640 | deg. K |
| Gamma0 | 0.001 | -50 | -50 | 15 | dB |
Table 2: Characteristics of Sentinel1-A (IW1-GRD-HR) Data.
| Parameters | Characteristics |
|---|---|
| Pixel value | Magnitude detected |
| Coordinate system | Ground range |
| Polarization options | Single(HH or VV) or Dual (HH+HV or VV+VH) |
| Resolution (range x azimuth in meters) | 20.4x21.7 |
| Pixel spacing (range x azimuth in meters) | 10x10 |
| Incidence angle (degree) | 32.9 |
| Radiometric resolution | 1.7 dB |
| Ground range coverage (km) | 251.8 |
| Absolute location accuracy (m) (NRT) | 7 |
| Equivalent Number of Looks (ENL) | 4.4 |
| Number of looks (range x azimuth) | 5 x 1 |
*Source: DeZan and Guarnieri (2006)
Reference and secondary data
Other datasets used in the study- Datasets pertaining to the study area are listed in this category. The rainfall dataset of the study area monthwise was referred. Also the soil map of the area was referred.
Sentinel-1A data
In this study, Sentinel-1A IW Level 1 (L1) GHDH (ground-range detected, high resolution) product was used. Sentinel data was acquired for the duration of July, 28 2018 to December, 28 2018 for the entire Mekong delta. Pre-processing of L-1 data was done using ERS open source Sentinel 1 toolbox. Pre-processing steps include Orbit file correction, geometric correction, radiometric correction, speckle filtering & Data conversion to dB.
Pre-processing of satellite data
Pre-processing is an operation with image at the lowest level of abstraction which suppresses unwanted distortion or enhances some image features important for further processing. The pre-processing depends on how the data was acquired (radar system and acquisition mode), and it was done using the tools available in the Sentinel1 toolbox of Snap software. The VV and VH polarized intensity bands are processed for subsequent analysis. The pre-processing includes the following steps:
Subsetting: The rectangular extent of the study was extracted from the base map and the raster images were subsetted to an extent from 11.459oN to 11.101o latitudes and then 79.337oW to 78.356oE longitudes. Subsetting of raster data reduces the time in further processing.
Orbital correction: Precise orbits are produced few weeks after acquisition, orbit files are downloaded from the following scientific data hub website https://qc.sentinel1.eo.esa.int/ and the precise orbital correction is done.
Calibration: The SAR calibration is to provide imagery in which the pixel values can be directly related to the radar backscatter of the scene [12-14]. The following equation given by Rosich and Meadows is used to produce the sigma naught value.
Value (i) =|DNi|2/Ai2
When, depending on the selected Look Up Tables (LUT),
Value (i) = one σ0i
Ai= sigma nought (i)
Bi-linear interpolation is used for any pixels that fall between points in the LUT. The calibrated images are maintained as an intensity image for further processing. [15] recommended speckle filtering whenever two or more images of the same scene taken at different times are available [15]. By exploiting the space varying temporal correlation of speckle between images, this filtering process significantly reduces the noise. Quegan et al., proposed algorithm for a sequence of N registered multi-temporal images, with intensity at position (X, Y) in the kth image denoted by Ik (X, Y), the temporal filtered images [16] are given by:
For k=1, …, N, where E[I] is the local mean value of pixel in a window centered at (X,Y) in image I. Based on this algorithm, multi-temporal speckle filtering was done separately for VV and VH stacked images with a recommended window size of 5*5 [6].
Geometric correction: Terrain corrections intend to compensate the distortions developed due to the topographical variation of a scene and the tilt of the satellite sensor so that the geometric representation of the image will be as close as possible to the real world and correct in WGS84 map projection, using Range Doppler terrain method. Re-sampling was carried out using Nearest-neighbour algorithm to closely preserve the spectral integrity of image pixel. The no-value pixels were taken care while processing as given in [17].
Post-processing of satellite data
The post-processing consists of optionally removing the noise to reduce the classification inaccuracy of SAR images caused by spectral mixing.
a) Conversion to decibel units: After de-speckling, the intensity values of SAR images are converted to decibel using the linear to dB conversion tool and exported as geo-tiff for further processing.
b) Co-registration and layer stacking: In order to render the application of subset operation possible, and to assure completely identical radiometric correction for the multi-look images are automatically co-registered subsequently and layer stacking was done. The VV and VH polarized images are separately stacked by maintaining the order from 02-September, 2017 to 24-January, 2018.
Ground truth collection
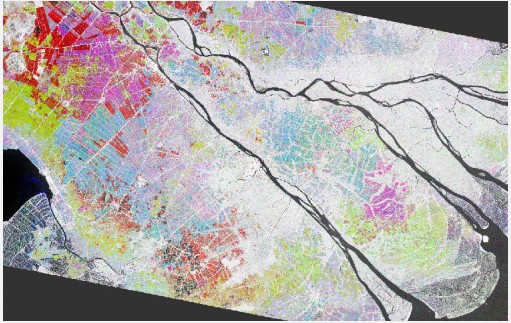
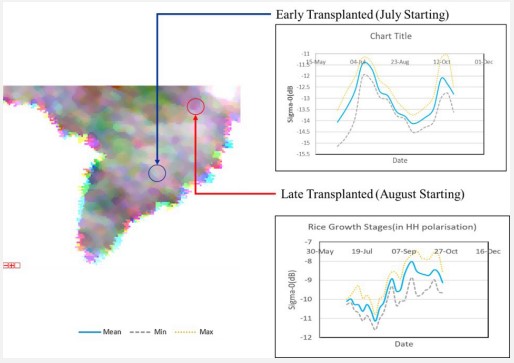
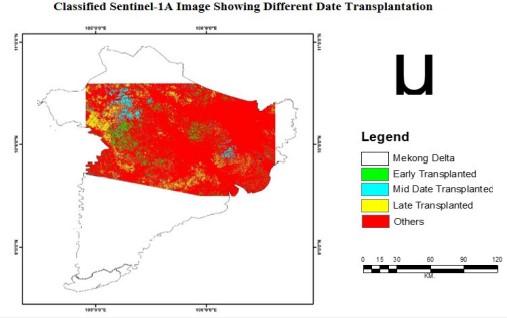
The field information collection was not physically required for this study as the rice crop signature has been well established in the coastal Odisha region and almost in every part in India. The Sentinel 1A data (3-date RGB) shown in figure 3 shows the widespread rice area in cyan (early sown), magenta tone (late sown) and yellow (very late sown). The blackish tone area seen in the east and west extreme part of the image is water body. These paddy signatures were extended to the Scatsat-1 data and used for classifying the paddy area.
Extension of signature and validation of outcome with sentinel-1 Data
High resolution Sentinel-1 Data with a spatial resolution of 10 m X 10 m is used for validation of the results (phenological stages i.e. transplantation) from SCATSAT-1 data. Sentinel-1 Data are used for demarcating rice fields with multiple date rice transplantation due to the lack of access of ground truths and Sentinel-1 Data are having very high resolution. The tonal signature based classification approach was established in late 90’s and validated using Radarsat 1 and 2, RISAT-1, and Sentinel-1. The above technique is being operationally used by MNCFC in synergy with state agriculture department for national level monitoring. The accuracy of the decision rule based classification was established and validated to be over 90%. Sentinel-1 Data (C-band) were used for comparing with the Ku-band SCATSAT-1 backscattering. These extended paddy signatures were validated independently post classification of the paddy area. Parallely the google earth images (courtesy: google earth) were also referred for steady conformation.
Crop phenophase and the response
Initial Period
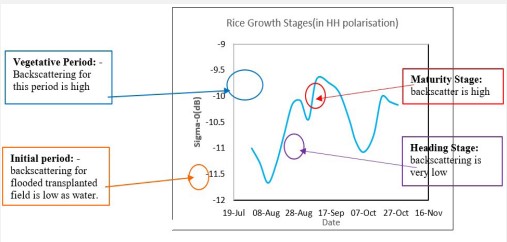
The transplantation phase is seen with very low backscattering. The backscatter from the flooded/freshly transplanted crop field was as low as water. It was found that the heterogeneity in transplanting date gives rise to a mixture of flooded fields and transplanted fields. The transplantation had taken place in multiple dates in different parts of Mekong delta. It can be observed that the backscattering of transplanted field lie between -20dB and -13 dB. Most of the early transplantation was done in low lying areas of Mekong delta it can be observed in the southern part of Mekong delta along Mekong River. This early sowing was because of the water logging in low lying areas.
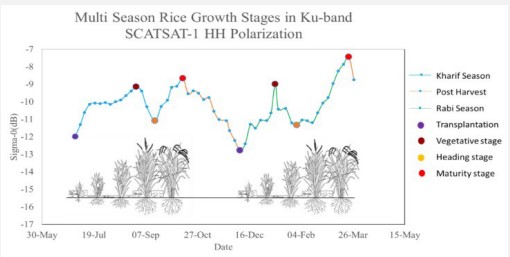
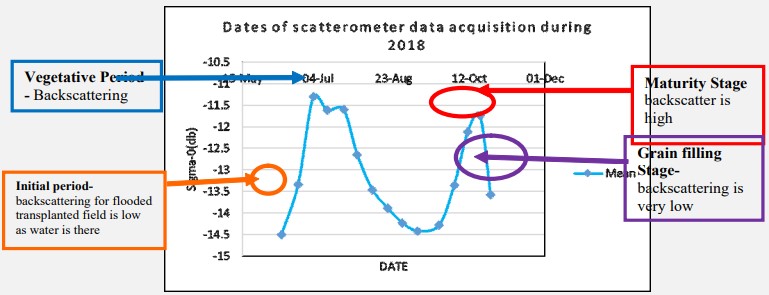
The backscattering at transplantation stage in Ku-band SCATSAT – 1 scatterometer data is between -15 dB and -13 dB for HH polarization (Figure 8) and -15 dB and -12 dB for VV polarization (Figure 14) and the backscattering at transplantation stage in C-band Sentinel-1A IW Level 1 data is between -20 dB and -18 dB for VH polarization (Figure 17) and -25 dB and -20 dB for VV polarization (Figure 15).
The early transplantation is mainly done in the month of June. Few transplantation had taken place in mid-July and late transplantation can be seen in the mid-August. A slow rise of backscatter (around 3-4 dB) was observed up to 20 days, coinciding with the early tillering stage. This was attributed to the increase in the double bounce scattering due to increase in the tillers (vertical structures). Similar results had been reported from the ground-based experiment conducted for rice using Ku band (VV, large angle) by Inoue et al. They had shown that the backscatter from rice fields increased after an initial dip during flooding, until the leaf area index reached around 1.5 (around 30 days). However, the rise was not as significant as that reported for ground observation. This may be due to the averaging of response in coarse resolution from not so uniform crop growth stage in all the fields for Ku-band but in C-band the rise can be observed clearly. This assumption was further strengthened from the fact that, as the heterogeneity in the rice pixel increased, this characteristic was more obscure.
Vegetative period
After the first peak, s° started declining for another 25-30 days. This coincided with the end of the vegetative stage (just before heading). The change in s° was higher during this period (4 dB). Backscatter minima were obtained during this stage for few cases, irrespective of plant proportion. This is in contrast to the C-band signature, where the backscatter minimum was at the transplanting stage. It can be attributed to the fact that in the Ku-band the surface scattering dominates, where vertical structure of the tillers/stems are masked with rise in leaf area. This gives rise to a decline in backscatter, where the surface acts more or less as a smooth surface to give minimum backscatter. The backscattering of Ku-band SCATSAT – 1 scatterometer data is between -12 dB and -11 dB for HH polarization (Figure 8) and -13 dB and -11 dB for VV polarization (Figure 14) and the backscattering of C-band Sentinel-1A IW Level 1 data is between -13 dB and -9 dB for VH polarization (Figure 17) and -13 dB and -9 dB for VV polarization (Figure 15).
Heading stage
The backscatter starts rising with the initiation of panicle (emergence of the inflorescence), up to the maturity stage (another 20– 25 days) (Figure 6). The Ku-band the surface scattering dominates therefore in heading deviation was observed. The backscattering of Ku-band SCATSAT – 1 scatterometer data is between -9 dB and -7 dB for HH polarization (Figure 8) and -9 dB and -7 dB for VV polarization (Figure 14) and the backscattering of C-band Sentinel-1A IW Level 1 data is between -22 dB and -17 dB for VH polarization (Figure 17) and -26 dB and -19 dB for VV polarization (Figure 15). This is attributed to the emergence of scatterers like panicle, spikelets, and grain that increase the surface scattering. Thus, two peaks were observed during the growth stage. Such a dual-peak trend had been reported for short frequency bands (Ka, Ku, X), particularly in VV polarization and large angle data (Inoue et al. 2002).
Maturity Phase and grain filling: The Ku-band the surface scattering dominates therefore in heading deviation was observed. The backscattering of Ku-band SCATSAT – 1 scatterometer data is between -11 dB and -12 dB for HH polarization (Figure 8) and -9 dB and -11 dB for VV polarization (Figure 14) and the backscattering of C-band Sentinel-1A IW Level 1 data is between -22 dB and -17 dB for VH polarization (Figure 17) and -26 dB and -19 dB for VV polarization (Figure 15). The grain filling backscatter decreases in both the polarization and stays around -13 to -14 dB during, further falls due to canopy drying in both the wavelength and start sensing the soil moisture at C-band.
Exponential curve smoothening: Exponential smoothing of time series data assigns exponentially decreasing weights for newest to oldest observations. In other words, the older the data, the less priority (“weight”) the data is given; newer data is seen as more relevant and is assigned more weight. Smoothing parameters (smoothing constants) usually denoted by α determine the weights for observations. Exponential smoothing is usually used to make short term forecasts, as longer-term forecasts using this technique can be quite unreliable. They are of three types:
Simple (single) exponential smoothing uses a weighted moving average with exponentially decreasing weights. Holt’s trend-corrected double exponential smoothing is usually more reliable for handling data that shows trends, compared to the single procedure. Triple exponential smoothing (also called the Multiplicative Holt-Winters) is usually more reliable for parabolic trends or data that shows trends and seasonality.
The basic formula is:
St= αyt-1 + (1 – α) St-1
where:
α = the smoothing constant, a value from 0 to 1. When α is close to zero, smoothing happens more slowly. Following this, the best value for α is the one that results in the smallest mean squared error (MSE). Various ways exist to do this, but a popular method is the Levenberg–Marquardt algorithm. In this study the value is taken as 0.5 to give equal weightage to the current value and the preceding value.
t = time period.
Many alternative formulas exist. For example, replaced yt-1 with the current observation, yt. Another formula uses the forecast for the previous period and current period:
𝐹𝑡 = 𝐹𝑡 − 1 + a At− 1 − Ft− 1 = 𝑎 ∗ 𝑎𝑡 − 1 + 1 − 𝑎 ∗ 𝐹𝑡 − 1
Where:
Ft – 1 = forecast for the previous period,
At – 1 = Actual demand for the period,
a = weight (between 0 and 1). The closer to zero, the smaller the weight.
The formula to use is usually a moot point, as most exponential smoothing is performed using software. Whichever formula to use though, we have to set an initial observation. This is a judgment call. It uses an average of the first few observations, or use set the second smoothed value equal to the original observation value to get the other values.
Following this, the best value for α is the one that results in the smallest Mean Squared Error (MSE). Various ways exist to do this, but a popular method is the Levenberg– Marquardt algorithm. t = time period. Many alternative formulas exist. For example, Roberts (1959) replaced yt-1 with the current observation, yt. Another formula uses the forecast for the previous period and current period: Where: Ft – 1 = forecast for the previous period, At – 1 = Actual demand for the period, a = weight (between 0 and 1). The closer to zero, the smaller the weight. The formula to use is usually a moot point, as most exponential smoothing is performed using software. Whichever formula to use though, we have to set an initial observation. This is a judgment call. We use an average of the first few observations, or use set the second smoothed value equal to the original observation value to get the other values.
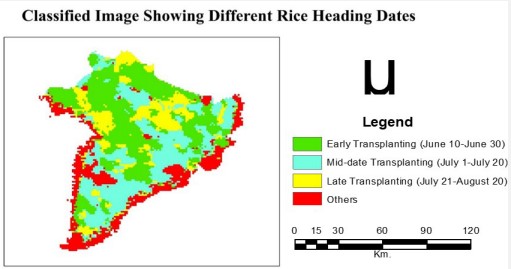
Decision tree classification: From the classification of the HH Polarisation scatterometer data using Decision tree algorithm it can be inferred that the backscattering value for different date rice transplantation with good separability and dates are allied with the results acquired from the plotting pattern of the rice crop and the Sentinel-1A data.
Table 3: Condition for classification of Different Date Transplantation Date in Sentinel-1A.
| Transplantation | Dates | Condition |
|---|---|---|
| Early | Transplantation | 23-Jul (B1 LE -15 AND B1 GT -30) AND (B2 LE 0 AND B2 GT -15) AND (B3 LE 0 AND B3 GT -15) |
| Mid Date | Transplantation | 28-Aug (B1 LE 0 AND B1 GT -15) AND (B2 LE -15 AND B2 GT -30) AND (B3 LE 0 AND B3 GT -15) |
| Late | Transplantation | 21-Sep (B1 LE 0 AND B1 GT -15) AND (B2 LE 0 AND B2 GT -15) AND (B3 LE -15 AND B3 GT -30) |
Decision tree classification
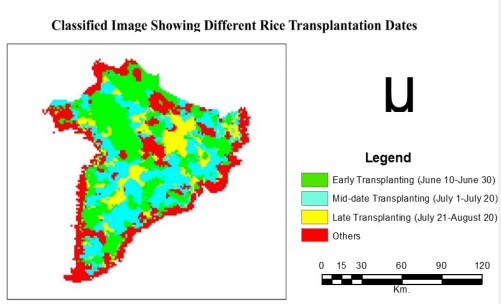
Step wise Hierarchical rule based classification was formulated and executed as given in. The classification of the HH Polarisation Scatterometer data using Decision tree approach with the threshholding values from table 5, hierarchal decision tree were developed to distinguish multi date rice transplantation and heading progress. It can be inferred that the backscattering value for different date rice transplantation had good separability (Figures 4 and 5). Also the classification results were observed to be coherent with the findings of [18,19] in vast tracts of the Mekong Delta in urban and Peri-urban Agriculture.
Accuracy assessment
The classification validation of the above study was carried out with multi date sentinel-1A data. The overall accuracy, producer’s and user’s accuracies were determined for both Transplantation and heading stage for HH polarization and the output is presented in figures 7-9. The overall accuracy for the classified transplanted and heading stage image are 78.96 and 80.21%. The producer’s accuracy for transplanted and heading stage are 82.50 and 78.75% respectively. The user’s accuracy of 75.42% for transplantation and 81.67% for heading was achieved. The decision tree classifier uses more advanced statistical analysis and uses the step wise knowledge base than other classifiers as reported [20] hence this was chosen. Kappa coefficients was reported to be 0.70. The kappa value was found to be as per the classification given by [21].
The Sentinel-1A data was also classified with an overall accuracy of 84.69%. The producer’s and user’s accuracies were determined for Transplantation stage as 78.019% and 91.04%. These results are coherent to the earlier findings [20].
The results from scattermeter data were found to have allied with the results acquired from the plotting pattern of the rice crop and the Sentinel-1A data with 72.04.
Conclusion
This Study uses SCATSAT-1 Ku band scatterometer data and Sentinel-1A IW Level 1 (L1) GHDH (ground-range detected, high resolution) product for monitoring rice crop phenology in Mekong Delta region of Vietnam. Temporal five-day composite of SCATSAT-1 data for 10 month was acquired for 2018-19 and 24 days composite of Sentinel-1A IW Level 1 data for 7 months starting from June till December was acquired for 2018-19 over the study area. The temporal backscatter of rice from transplanting to maturity stage showed a characteristic dual peak profile in Ku-band SCATSAT-1 data. On the other hand, in C-band the lowest backscattering was observed during transplantation and after that the backscattering increases gradually. From this we can conclude that a difference in the pattern of profile and range of backscattering in Ku-band and C-band can be observed at different phenological stage of rice crop. The transplantation can be observed in both the bands clearly, but in Ku-band the heading stage can be observed more accurately as a low backscattering can be observed during heading stage in Ku-band while no such distinguishing pattern can be observed in C-band. The pattern matched well with the observations reported by other studies using the Ku-band scatterometer for the rice crop monitoring.
Table 4: User and producer accuracy for different rice classes based on transplantation dates.
| Class Name | Producers Accuracy | Users Accuracy |
|---|---|---|
| Early | 85.00% | 80.00% |
| Mid | 90.00% | 75.00% |
| Late | 70.00% | 66.67% |
| Others | 85.00% | 80.00% |
Table 5: User and producer accuracy for different heading dates.
| Class Name | Producers Accuracy | Users Accuracy |
|---|---|---|
| Early | 90.00% | 90.00% |
| Mid | 75.00% | 90.00% |
| Late | 80.00% | 66.67% |
| Others | 85.00% | 80.00% |
Table 6: User and producer accuracy for different transplantation dates in sentinel-1A.
| Class Name | User Accuracy | Producer Accuracy |
|---|---|---|
| Early Transplanted | 100 | 85.71 |
| Mid Date Transplanted | 100 | 56.25 |
| Late Transplanted | 82.35 | 73.68 |
| Others | 81.81 | 96.42 |
| Average | 91.04 | 78.01 |
The backscatter minima coincided with the dominant transplantation stage in Ku-band and the second minima coincided with maximum heading period in most of the areas. The backscatter increased thereafter up to maturity stage. This is in contrast to the C-band response, where the backscatter increases with crop growth. The profile was modelled using exponential smoothing to derive the heading stage. The derived Ku-band observation matched well with the observations derived from Sentinel-1. A linear fit explained the increase in backscatter from heading to maturity stage very well with the observations derived from Sentinel-1. The slope of the fit showed significant change in relation to crop stage and type. The transplantation stage classified maps were prepared for both Ku-band and Cband and it was found that both the maps are 72.04% correlated. The heading stage map prepared from Ku-band also has agreement with the transplantation map.
This is in contrast to the C-band response, where the backscatter increases with crop growth. Thus, backscatter response in the Ku-band at the later crop stage shows potential in relation to grain yield. Further analysis of the data in relation to quantification of panicle parameters like grain number and size is planned.
Further analysis of the data in relation to quantification of panicle length and grain yield may be planned. Although the spatial resolution is a limiting factor for local area study, this study indicates the utility of Ku-band scatterometer data that provides complementary information to longer wavelength bands for crop monitoring in regional scale.
References
- Haldar DM, Chakraborty KR. Manjunath. Parihar Role of Polarimetric SAR data for discrimination/biophysical parameters of crops based on canopy architecture. ISPRS Archives. 2014.
- Haldar D, Chakraborty M. Characterization of monsoon and summer season paddy transplantation date in India using RISAT-1 Synthetic Aperture Radar. 2018.
- Toan TL. Rice Crop Mapping and Monitoring Using ERS-1 Data Based on Experiment and Modeling Results. IEEE Transactions on Geoscience and Remote Sensing. 1997; 35: 41-56.
- Ribbes F. Rice Field Mapping and Monitoring with RADARSAT Data. International Journal of Remote Sensing. 1999; 745-765.
- Potin PP. Sentinel-1 Mission Operations Concept. Geoscience and Remote Sensing Symposium (IGARSS), 2012 IEEE International, Munich. 2012.
- Chakraborty M, Manjunath KR, Panigrahy S, Kundu N, Parihar JS. Rice crop parameter retrieval using multi-temporal, multiincidence angle Radarsat SAR data. ISPRS Journal of Photogrammetry and Remote Sensing. 2005; 59: 310-322.
- Blaes Xavier, Pierre Defourny. Retrieving Crop Parameters Based on Tandem ERS 1/2 Interferometric Coherence Images. Remote Sensing of Environment. 2005; 88: 374-385.
- Bouman B, Van Kasteren H. Ground-based x-band (3cm wave) radar backscattering of agricultural crops. ii: Wheat, barley and oats; the impact of canopy structure. Remote Sensing Environment. 1990; 34: 107-118.
- Agriculture. 2019.
- Masutomi YK. Impact Assessment of Climate Change on Rice Production in Asia in Comprehensive Consideration of Process/ Parameter Uncertainty in General Circulation Models. Agriculture, Ecosystems & Environment. 2009; 131: 281-291.
- Santasombat Y. Impact of China’s Rise on the Mekong Region. New York: Palgrave Macmillan. 2015.
- Rosich B. Absolute calibration of ASAR Level 1 products. European Space Agency. 2004; 1.
- Laur HP. ERS SAR Calibration: Derivation of σ0 in ESA ERS SAR PRI Products. ESA/ESRIN, ES-TN-RS-PM-HL09. 2004; 2.
- Lavalle M. Absolute Radiometric and Polarimetric Calibration of ALOS PALSAR Products. European Space Agency. 2008; 2: 1-26.
- De Grandi GF. Radar reflectivity estimation using multiplicative SAR scenes of the same target: technique and applications. IEEE 1997 International Geoscience and Remote Sensing Symposium Singapore. 1997; 1047-1050.
- Quegan SG. Land use/cover classification and rice mapping based on ENVISAT ASAR data. The 2005 Dragon Symposium "Mid-Term results", 2005.
- Carlo. Masking “No-value” Pixels on GRD Products generated by the Sentinel-1 ESA IPF, Mission Performance Centre-0243, 2015; 1.
- Forkuor G, O. Cofie. Dynamics of land-use and land-cover change in Freetown, Sierra Leone and its effects on urban and peri-urban agriculture-A remote sensing approach. International Journal of Remote Sensing. 2011; 32: 1017-1037.
- Friedl MA, Brodley CE. Decision tree classification of land cover from recently sensed data. Remote Sensing Environment. 1997; 61: 399-409.
- Choudhury I, Chakraborty M. SAR signature investigation of rice crop using RADARSAT data. International Journal of Remote Sensing. 2006; 27: 519-534.
- Congalton RC. A review of assessing the accuracy of classifications of remotely sensed data. Remote Sensing Environment.1991; 37: 35-46.

