1Department of Bioinspired Materials and Biosensor Technologies, Institute of Materials Science, Faculty of Engineering, Kiel University, Germany.
2Department of Biotechnology and Plant Breeding, Islamic Azad University Science and Research Branch, Tehran, Iran.
3Radiation Biology Research Center, Iran University of Medical Sciences (IUMS), Tehran, Iran.
Ghazizadeh E
Email: elhamgenetic@gmail.com
Received : Jun 18, 2025 Accepted : Jul 11, 2025 Published : Jul 18, 2025 Archived : www.meddiscoveries.org
Breast cancer is the most common malignancy in women and finding molecular markers to diagnose this cancer in the early stages of development is crucial. Increased expression of genetic variants is a common occurrence in cancers. This study aimed to identify the genetic variants involved in breast cancer using RNA seq technique. In this study, 7 cancer samples and 4 control samples were included in the study. After receiving information from the database, the quality of the data was checked using Fast QC software. After checking the quality of the data, the reference genome was mapped using the Ensemble site. To determine the variants associated with this disease, the variants were identified and then examined separately for chromosomes. Our results show that the 1012140 variants were found, of which 993770 are related to SNP and 1830 are related to INDEL. The results also showed that several variants were identified in each chromosome, some of which are in the intron region and some of which are Frameshift variants. Our study suggests that increased expression of genetic variants can indirectly lead to tumorigenesis in the breast. Our findings provided new insights into the genetic variants in Breast Cancer, which can serve to design appropriate breeding programs.
Keywords: Breast cancer; RNA seq; Genetic variant; Chromosome segregation.
Breast cancer is the third most frequent cancer in the world as it affects approximately one in ten women in the Western world [1]. The initial knowledge that connected breast cancer to genetic susceptibility originated from the clinical observations that highlighted the clustering of breast cancer cases in families. Approximately 5-10% of breast cancers are believed to result from the inheritance of rare genetic components that confer significantly elevated risk [2,3]. For example, mutations in the tumor suppressor genes BRCA1 and BRCA2 account for approximately 16% of familial breast cancer. The vast majority of breast cancer cases, however, are derived from a complex interaction between multiple environmental, lifestyle and genetic factors with relatively weak individual risk contribution [4]. While the effects of many environmental and lifestyle factors, such as diet, reproductive behavior and radiation are well appreciated, the knowledge of genetically contributing patterns is limited. Association studies have identified ATM, BRIP1, CASP8, CDH1, CHEK2, PALB2, PTEN, STK11, and TP53 as breast cancer susceptibility genes. Such mutations collectively account for 2.3% of the familial risk of breast cancer, and together with BRCA1, BRCA2 and others have been implicated in high-risk screening strategies. Nonetheless, a significant proportion of familial and non-familial breast cancer susceptibility remains unknown, suggesting a plethora of genetic elements that need to be understood [5,6]. One of the main challenges is the translation of tumor genome-based information into clinically actionable findings. This relies not only on the identification of biologically relevant alterations that can be used as therapeutic targets or predictive biomarkers but also on the availability of appropriate reporting tools. These reporting tools need to integrate the wealth of genomic data and make it usable in a routine clinical setting. This will provide additional treatment options based on the genetic nature of the patient’s tumor, enabling truly individualized cancer medicine [7,8]. Gene expression profiling using RNA-sequencing (RNA-Seq) is an ideal tool to assess the molecular heterogeneity of breast cancer to inform individualized medicine. It enables the estimation of transcript abundance, the detection of altered genes and molecular pathways, the detection of fusion genes and the reliable identification of genomic variants [9]. RNA-Seq can be performed for nearly all breast cancer and metastatic breast cancer patients who require therapy using tissue collected during routine biopsy. To address this case, we research the genetic variants involved in breast cancer will be investigated and identified using the RNA-seq technique.
Data collection
The RNA-Seq dataset used in this study was obtained from our previous study along with 7 cancer samples, all of which were treated with the same protocols. Detailed information about the samples and the experimental design have been described previously [9]. The accession number of samples exists in Table 1. This information was collected from the SRA database (Sequence Read Achieve) which was the archive of short readings from NIH sequence data (Table 1).
| Sample name | SRA code |
|---|---|
| ShMETTL18-3 | SRR 10662497 |
| ShMETTL18-2 | SRR 10662492 |
| ShMETTL18-1 | SRR10662493 |
| Shc-4 | SRR10662494 |
| Shc-3 | SRR10662495 |
| Shc-2 | SRR10662496 |
| Shc-1 | SRR10662497 |
RNA‑Seq data processing
RNA-seq reads were processed through a quality control and trimming approach using FastQC (v0.11.5) and Trimmomatic (v0.35) tools to remove low-quality reads/bases and adaptor sequences, respectively. Trimmomatic was executed using its adaptive trimming algorithm, maximum information (MAXINFO:120:0.9), to balance the benefits of retaining longer reads against the drawback of having low-quality bases. Also, minimum score (TRAILING) and minimum length (MINLEN) were set to 20 and 120, respectively.
Quality control
Quality Control (QC) of raw RNA-Seq, reads was implemented using Fast-QC. Basic QC statistics are listed tabular and linked to the full report generated by FastQC as follows:
1) Post-alignment QC included computation of insert size distribution and collecting basic RNA-Seq metrics using functionalities provided by Picard tools. RNA-Seq reads were aligned to the human genome using a STAR aligner [10].
2) Alignment statistics were reported in a table within the report.
3) Indexing genome is to trim the reads at one or both ends so that only a region of high-quality bases is left. This is done by specifying a threshold value (using the `-c’ option) for low-quality base calls [11]. Indexing a genome can be explained as similar to indexing a book.
4) The mapping process was done to compare each one of the reads with the reference genome. We will obtain one alignment, or more, between each read and the genome.
5) SAM tools are used to tab the SAM file to BAM. The SAM tools software reads these formats and builds, merges and syncs them, and can quickly retrieve readings in any region [12].
6) MarkDuplicates was done to detect and label duplicate readings in BAM or SAM, instead of repeating readings, it has a proper definition of the isolated DNA fragment [13].
7) Variant calling was implemented using SNPiR, a highly accurate approach to identifying SNPs in RNA-seq data. Basic genetic information was annotated using SnpEff and information was provided by dbNSFP. Variants were further filtered based on being described as either common/no known medical impact in the NCBI [14].
Sequencing and alignment for quality control results
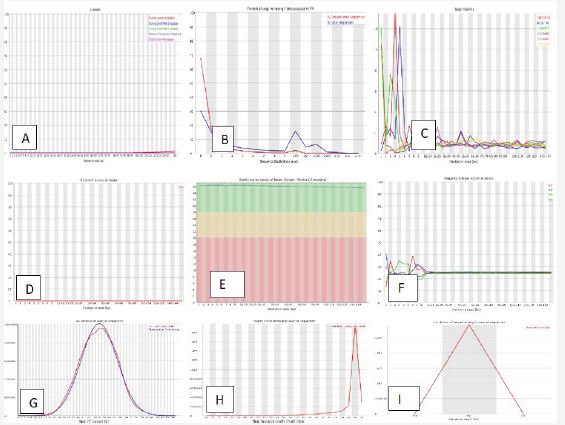
In addition to the list of readings, Fast QC reported information on the quality and content of the bases, the length of the readings, as well as the presence of ambiguous and doubled bases. In this study, 7 samples including 3 cancer samples were reported and 4 control samples. The result of controlling the quality of the data is shown in Figures 1 and S1. (a-f). Each figure contains 9 images. In the following, we will explain each shape.
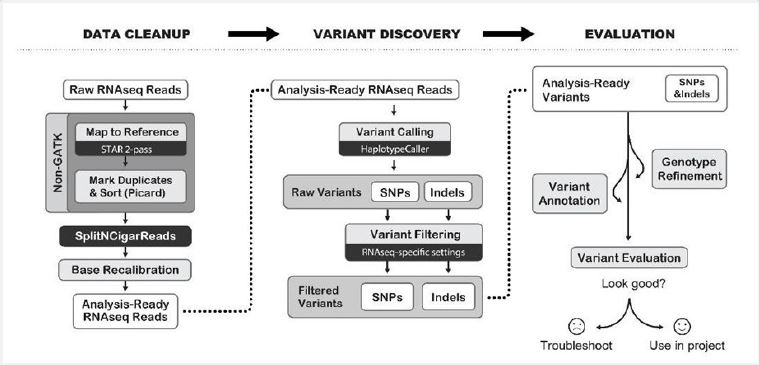
It is necessary to map the reference genome. The reference genome must be downloaded from the Ensemble site. The results related to the alignment of the reads with the reference genome, which was done using the HISAT2 software, were in the form of a SAM file, which is shown in Figure 2s (a,b). The output of this tool is a serious BAM or SAM file (Figure 2A), which is specified in the repeated versions in the SAM flags section for each reading.
SplitNCigarReads show the input file is BAM and the output file is BAM file in Figure 2b. Then, the input file is shown as a BAM file that creates different variants in the Variant Calling process. The output data about variant calling is a VCF or GVCF file in supplement try materials of Figure 2s, Table 1s.
INDEL results
In this study, 1012140 variants were found, of which 993770 are related to SNP and 1830 are related to INDEL (Figure 4). To determine the variants associated with this disease, the variants were identified and then chromosomes were examined separately. To show the number of variants within each chromosome and consider the importance of INDELs and their importance in cancer, they were examined, which are observed separately for each of them on chromosomes 2 to 22 (Table 1s & Figure 3s).
Differential filtering of genes
To filter genes with differential expression in the data obtained from the BioDBnet site, two parameters p value <0.05 and Log2 >0.01 were used. To do this, the Ensembl Gene ID format was first used, and after obtaining the gene symbols, the desired information was saved in an Excel file with the information obtained from the parameters base mean, log2FoldChange, lfcSE, stat, p-value and padj by R software was compared.
In total, the results of differential gene expression analysis showed 7428 differentially expressed genes, for some of which Gene Symbols were found on the BioDBnet site, and for others, Gene Symbols were not found, and these genes should be reported as the same Ensembl ID. did in the following, these differentially expressed genes were further investigated. A volcano diagram was used to show the differential expression of genes (Figure 3a). In this diagram, three color spectrums were used to show genes with different expressions. The green color was used for genes that have increased expression, these points are for genes that have p-value <0.05 and Log2 >0.01. Second, the red color is for genes that have decreased expression, these points are also for genes with p-value <0.05 and Log2 > -0.01. Third, the yellow color corresponds to the genes that had an inappropriate p-value, i.e. p-value >0.05, and therefore, the genes that had an inappropriate p-value were marked with yellow color, and in other words, the genes that are placed in this color spectrum (yellow color) significantly have not increased or decreased expression.
Examining the amount of log2 fold change and p-value (p-value <0.05 and <-0.03 to <+0.03 Log2) as the two main criteria for distinguishing genes with different expression showed that among 7428 genes, 49 genes had a different expression level. based on the range that was determined. It should be mentioned that by changing this range, which is mentioned in some articles, genes with more expression differences can be identified. We used a strict range for this analysis (<-0.03 to <+0.03 Log2). Therefore, 49 genes were finally identified, of which 27 had decreased expression and 22 had increased expression (Figure 4s, Table 2s).
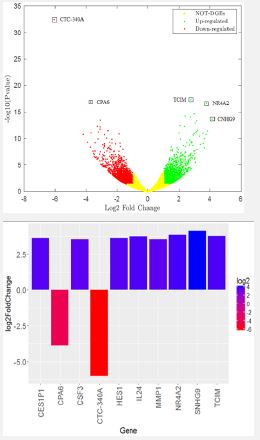
Also, another column chart was drawn to show 10 genes that had a different expression level than other genes among these 33 genes. So eight genes CES1P1, CSF3, HES1, IL24, MMP1, NR4A2, SNHG9 and TCIM have the highest expression level or in other words, the highest significant expression level and two genes CPA6 and CTC-340A have the lowest expression level or in other words, the lowest significant expression level have shown that in this study these 10 genes were reported as index genes with significant differences in expression (Figure 3b).
RNA-Seq is a powerful sequencing-based method that enables researchers to determine the sequencing and quantity of RNA transcripts of the complete product of gene expression (transcriptome). This technique is used to examine newly sequenced genomes and identify new genes or isoforms. Its properties are valuable in organisms whose genetic interpretation is still incomplete and also allow us to study genetic activity in different tissues of organisms, stages, or under different conditions [15,16]. Variant calling is the process by which it identifies sequence data types. This process identifies SNPs and INDELs from next-generation sequence data [17,18]. INDELs are more important than SNPs because they diversify the human genome and can also act as tumor suppressors by enriching oncogenic genes [19]. Researchers have found that medium-sized INDELs play a major role in cancer, although they are difficult to diagnose. 20 to 30% of people with breast cancer have a family history of this cancer. Local breast tissue is common for potentially fatal malignancies in women. Among the genes involved in breast cancer, Src, Her-2, BRCA1 / 2, can be mentioned. According to the results, INDELs have a wider role in cancer [21,22]. Genes were searched for chromosomes, genes involved in cancer were examined, and the molecular structure and mechanism of each were examined. Some of these genes, including LSR, were implicated in breast cancer [23,24]. In the present experiment, using bioinformatics tools and existing databases and data analysis using existing software, 1012140 variants were identified, of which 993770 were related to SNPs and 18370 were related to INDELs. Due to the importance of INDELs, four genes were found in Breast cancer is involved. Other articles have shown that these genes are involved in breast cancer, and the results were consistent with the results of experiments.
In the present study, four genes involved in breast cancer were found, including SH3BGRL2, LSR, USP36, and USP20, located on chromosomes nine, seventeen, nineteen, and twenty-one, respectively. The USP20 gene is involved in increasing breast cancer migration and metastasis. USP36 gene in research It is overexpressed in the invasion of breast cancer cells. The LSR gene stimulates the lipoprotein receptor in the breast and causes cancerous behavior. The SH3BGRL2 gene has a dual function in breast cancer and causes metastasis. According to studies, the role of these genes in other cancers has not been investigated and needs further testing and research in this area. Future studies can be investigated on the expression of genes obtained in the present study in other cancers and knowledge about the mutations of the genes obtained in breast cancer with molecular pathways of genes obtained in the present study and their role in breast cancer.